Mathematics notes, unit 8
Data
Textbook Mathematics Year 1 (DLP), Textbook Part 1 and Part 2, pages Part 2, 75–84
What this chapter covers
- You can collect data and make a tally, counting in fives (8.1.1)
- You can read a pictograph and use its key (8.2.1)
- You can find the most and the least in a pictograph (8.2.1)
- You can solve simple problems using a tally table or a pictograph (8.3.1)
8.1Collect data
Data is information we collect. We can count how many children play each game.
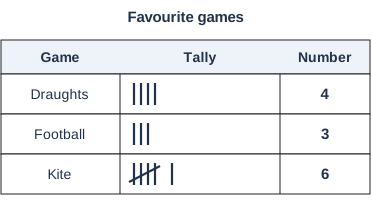
A tally helps us count. We make a mark | for each one. The fifth mark crosses the four marks.
Make a tally
1. Look at each child. Make one mark |.2. Make the fifth mark across the four.
3. Count the marks. Write the number.
Count the groups of five first: 5, 10 ... Then count the single marks.
A tally has one group of five and 2 marks. What is the number?
Show answerHide answer
5 + 2 = 7.
8.2Pictograph
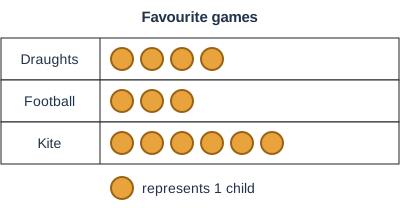
A pictograph uses pictures or symbols to show data. The key tells us what one symbol stands for.
Read the pictograph
Children who play draughts: 4.The most favourite game has the most symbols: kite.
The least favourite game has the fewest symbols: football.
Read the key first. One symbol may stand for 1 child or for RM1.
Look at the pictograph. How many children like football?
Show answerHide answer
3 children.
8.3Solve problems
Count the symbols in each row, then add or take away to answer.
Use the fruit pictograph
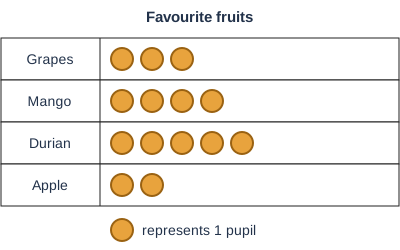
Which is the most favourite fruit? Durian has 5 symbols, the most. Durian.How many pupils like mango? 4 pupils.
How many pupils altogether? 3 + 4 + 5 + 2 = 14.
"Most" is the biggest number. "Least" is the smallest number. "How many more" means take away.
The most favourite fruit is the name. Write "durian", not "5".
How many more pupils like durian than apple?
Show answerHide answer
5 − 2 = 3 more pupils.
Summary
- Data is information we collect. A tally counts in groups of five.
- A pictograph uses symbols. The key tells what one symbol stands for.
- Most = the biggest number. Least = the smallest number.