Mathematics questions, unit 8
Nama / NameKelas / ClassTarikh / Date
Data
26 marks. Use Practice to check each answer as you go, or Exam to answer everything first. Read each bar chart carefully.
Section A: objective questions
12 marksChoose the correct answer.
1
Question 1
What do we use to count the answers quickly when we collect data?
Show answerHide answer
D
Strokes in groups of five make a tally, which is quick to count.
2
Question 2
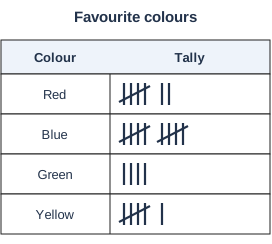
Diagram 1 shows a tally of favourite colours. How many pupils like red?
Show answerHide answer
C
Red has one group of five and 2 strokes: 5 + 2 = 7.
3
Question 3
Look at Diagram 1. Which colour is the most favoured?
Show answerHide answer
B
Blue has two groups of five = 10, the most.
4
Question 4
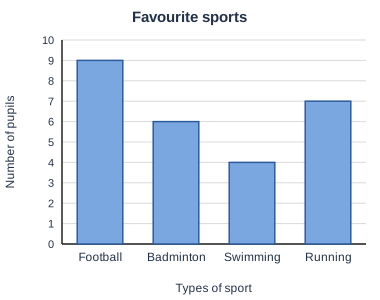
Look at Diagram 2. What does the vertical axis show?
Show answerHide answer
C
The side of the chart is labelled Number of pupils. The types of sport are along the bottom.
5
Question 5
Look at Diagram 2. How many pupils like swimming?
Show answerHide answer
D
The swimming bar ends at 4.
6
Question 6
Look at Diagram 2. Which sport is the most favoured?
Show answerHide answer
A
Football has the tallest bar, 9 pupils.
7
Question 7
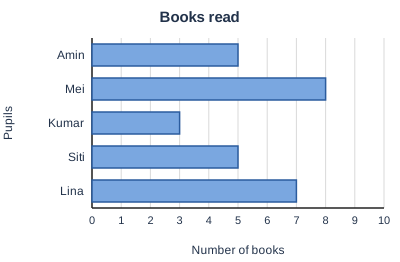
Diagram 3 is a horizontal bar chart. Who read 7 books?
Show answerHide answer
C
The bar for Lina ends at 7.
8
Question 8
Look at Diagram 3. Which two pupils read the same number of books?
Show answerHide answer
B
Amin and Siti both read 5 books.
9
Question 9
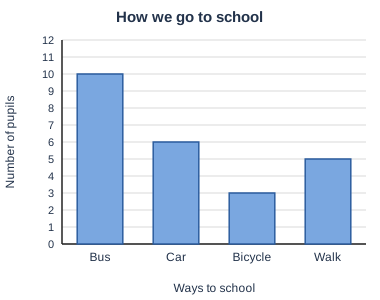
Diagram 4 shows how pupils go to school. How many more pupils come by bus than by car?
Show answerHide answer
D
Bus 10, car 6. 10 − 6 = 4.
10
Question 10
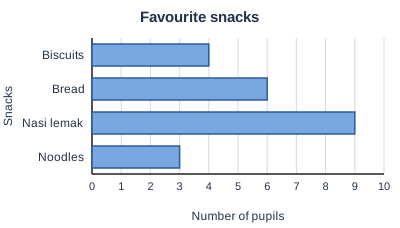
Look at Diagram 5. How many pupils were asked altogether?
Show answerHide answer
A
4 + 6 + 9 + 3 = 22.
11
Question 11
Look at Diagram 5. Which two snacks together are liked by 13 pupils?
Show answerHide answer
C
9 + 4 = 13 for nasi lemak and biscuits. The others make 10, 9 and 12.
12
Question 12
Look at Diagram 2. The school wants to buy new equipment for the sport that most pupils like. Which equipment should it buy?
Show answerHide answer
A
The most favoured sport is football, so footballs are the best choice.
Section B: structured questions
14 marksAnswer all questions.
13
Question 13
Look at Diagram 1 again. It shows the tally of favourite colours chosen by a group of pupils.
[1 mark]
(a)How many pupils like green?
Show answerHide answer
Tick each point you got.
[1 mark]
(b)Which colour is the least favoured?
Show answerHide answer
Tick each point you got.
[1 mark]
(c)How many pupils chose a colour altogether?
Show answerHide answer
Tick each point you got.
14
Question 14
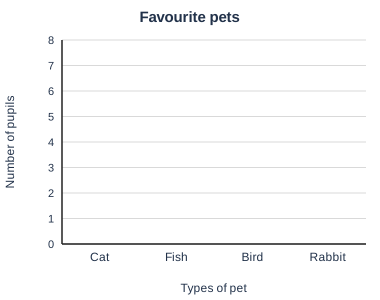
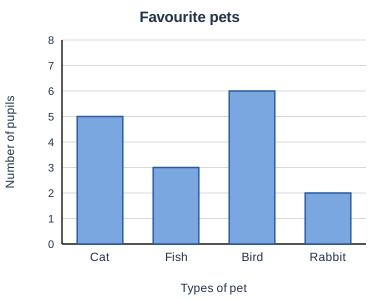
The table shows the favourite pets of some pupils. Diagram 6 is the empty bar chart.
| Pet | Cat | Fish | Bird | Rabbit |
|---|---|---|---|---|
| Number of pupils | 5 | 3 | 6 | 2 |
[2 marks]
(a)Draw the bars to complete the chart.
Show answerHide answer
The finished chart:
Tick each point you got.
[1 mark]
(b)Which pet is the most favoured?
Show answerHide answer
Tick each point you got.
15
Question 15
Look at Diagram 4 again. It shows how a group of pupils go to school.
[1 mark]
(a)How many pupils walk to school?
Show answerHide answer
Tick each point you got.
[1 mark]
(b)How many pupils come by car and by bicycle altogether?
Show answerHide answer
Tick each point you got.
[1 mark]
(c)How many pupils are there altogether?
Show answerHide answer
Tick each point you got.
16
Question 16
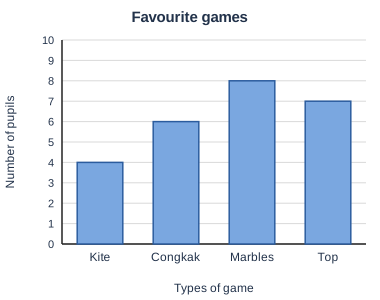
Diagram 7 shows the favourite games of Year 2 pupils.
[1 mark]
(a)Which game is the second most favoured?
Show answerHide answer
Tick each point you got.
[1 mark]
(b)How many more pupils like marbles than kite?
Show answerHide answer
Tick each point you got.
[1 mark]
(c)Amin says, "Kite is the most favoured game because it is the first bar." Is he correct?
Show answerHide answer
No
The most favoured game has the tallest bar, which is marbles.
17
Question 17
Look at Diagram 2 (favourite sports) again.
[1 mark]
(a)Write one question that can be answered from the chart.
Show answerHide answer
Tick each point you got.
[1 mark]
(b)Write the answer to your question.
Show answerHide answer
Tick each point you got.