Mathematics notes, unit 8
Data
Textbook Mathematics Year 2 (DLP), Part 1 and Part 2 (one combined PDF), pages Part 2, 91–100
What this chapter covers
- You can collect data by asking and counting, and arrange it in a tally table (8.1.1)
- {'You can name the parts of a bar chart': 'title, axes, bars (8.2.1)'}
- You can read information from vertical and horizontal bar charts (8.2.1)
- You can find the most and the least favoured, and compare numbers in a chart (8.3.1)
- You can solve simple problems using data in a table or a bar chart (8.3.1)
8.1Collecting data
Data is information that we collect, for example the pets that pupils like. To collect data we ask questions and then count the answers.
A tally helps us count. We make one stroke for each answer. Every fifth stroke crosses the other four, so we can count in fives.
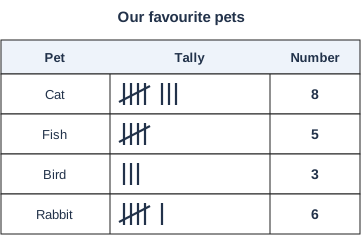
Collect data about favourite pets
1. Ask each pupil: "Which pet do you like best?"2. Make one stroke in the tally column for each answer.
3. Count the strokes and write the number.
4. Check: 8 + 5 + 3 + 6 = 22 pupils were asked.
Another way is to draw a picture or a square for each answer, then count the squares.
Count tally groups in fives: 5, 10, 15 ... then add the single strokes.
A tally shows one group of five and 2 strokes. What number is it?
Show answerHide answer
5 + 2 = 7.
8.2Bar charts
A bar chart uses bars to show data. A taller or longer bar means a bigger number.
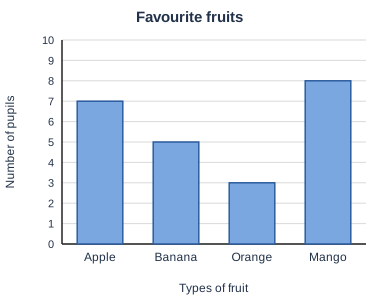
| Part | What it tells us |
|---|---|
| Title | What the chart is about |
| Horizontal axis | The line across the bottom. Here it shows the types of fruit. |
| Vertical axis | The line up the side. Here it shows the number of pupils. |
A bar chart can also lie down. This is a horizontal bar chart. The names are on the vertical axis and the numbers are along the bottom.
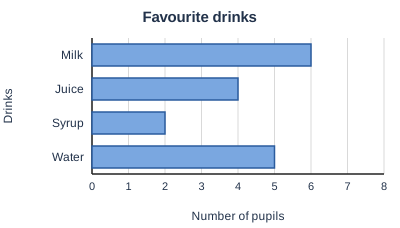
Read the drinks chart
Pupils who like milk: 6. Pupils who like juice: 4.The most favoured drink has the longest bar: milk.
The least favoured drink has the shortest bar: syrup.
Read the number where the end of the bar touches the scale. Do not count the number of bars.
Look at the fruit chart. How many pupils like bananas? Which fruit is the least favoured?
Show answerHide answer
5 pupils like bananas. Orange is the least favoured (3 pupils).
8.3Solving problems with data
To answer a question, find the right bar or row, read the number, then add or subtract if needed.
Use the fruit chart
How many more pupils like apples than oranges?Apples 7, oranges 3. 7 − 3 = 4 more pupils.
How many pupils were asked altogether?
7 + 5 + 3 + 8 = 23 pupils.
"Most" means the biggest number. "Least" means the smallest number. "How many more" means subtract.
The most favoured one is the name of the bar, not the number. Write "mango", not "8".
In the drinks chart, how many pupils like juice and water altogether?
Show answerHide answer
4 + 5 = 9 pupils.
Summary
- Data is information we collect. A tally counts answers in groups of five.
- A bar chart has a title and two axes. A taller or longer bar means a bigger number.
- Read the number where the end of the bar meets the scale. Most = biggest number, least = smallest number.
- "How many more" means subtract. "Altogether" means add.