Data
What this chapter covers
- You can collect data, then classify and sort it in a table using tally marks or ticks (9.1.1)
- You can read a pie chart and say which part is the most, the least and how many are in each part (9.2.1)
- You can see that a pictograph, a bar chart and a pie chart can show the same data, and find the same information in all three (9.3.1)
- You can solve everyday problems using data in tables, pictographs, bar charts and pie charts (9.4.1)
9.1Collecting, classifying and sorting data
Anuar sits in front of his house. He writes down the colour of every car that passes by. These are his notes:
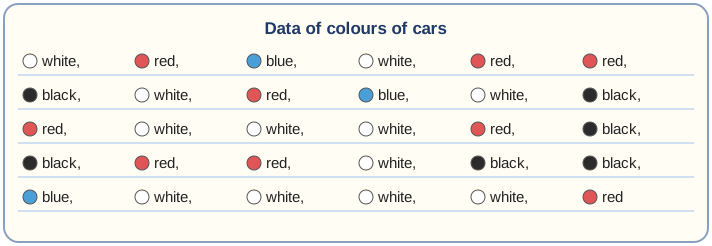
The list is long and messy. Let us classify the colours into four groups and sort them in a table.
- Draw a table with three columns: Colour of car, Tally and Number.
- Read the list one word at a time. For each word, draw one stick in the right row. Cross out the word so you do not count it twice.
- Count the tally marks in fives: 5, 10, then the extra sticks. Write the total in the Number column.
- Check: 12 + 9 + 3 + 6 = 30. Anuar wrote 30 colours, so the table is correct.
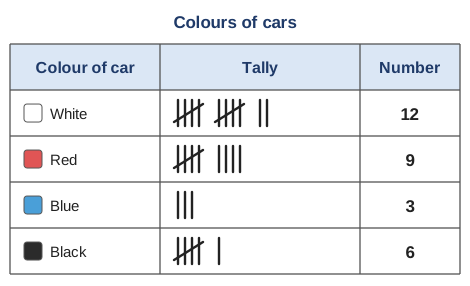
Some people use ticks (✓) instead of tally marks. White would have 12 ticks. Both ways work, but tally marks in groups of five are faster to count.
Show answerHide answer
9.2Reading a pie chart
Here is Anuar's car data again, drawn as a pie chart.
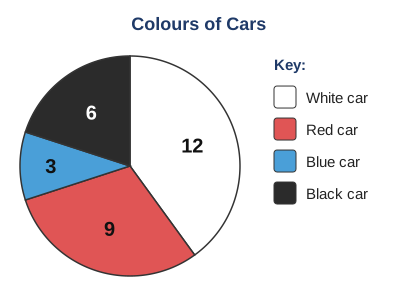
Every pie chart has three things to look at:
| Part | What it tells us | In this pie chart |
|---|---|---|
| Title | What the data is about | Colours of Cars |
| Key | Which colour stands for which group | Blue part = blue car, and so on |
| Numbers in the parts | How many are in each group | 12, 9, 6 and 3 |
- How many colours were observed? Count the parts: there are 4 colours.
- The largest part is white, with 12. So white cars are the most.
- The smallest part is blue, with 3. So blue cars are the least.
- How many red cars? Find red in the key, then read the red part: 9.
- How many cars altogether? 12 + 9 + 6 + 3 = 30 cars.
Show answerHide answer
9.3Pictographs, bar charts and pie charts
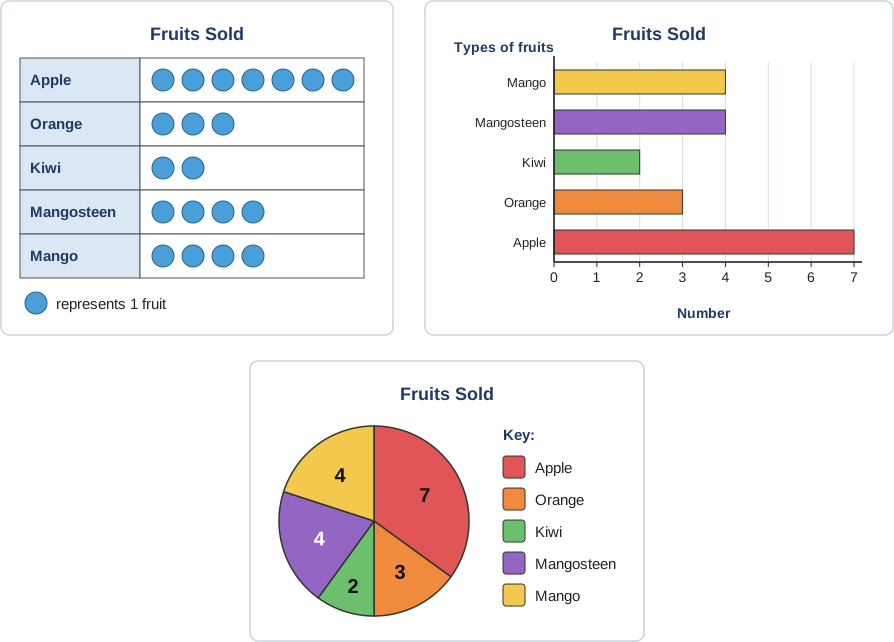
You may have seen pictographs and bar charts before. The same data can be shown in all three kinds of chart.
| Chart | How it shows a number | The most is… |
|---|---|---|
| Pictograph | Pictures. The key tells you what one picture stands for. | the row with the most pictures |
| Bar chart | Bars. Read the number on the axis at the top of the bar. | the highest (or longest) bar |
| Pie chart | Parts of a circle, with the number written inside. | the largest part |
Cikgu Aminah asked four pupils how many books they read last month. She showed the answers in three charts.
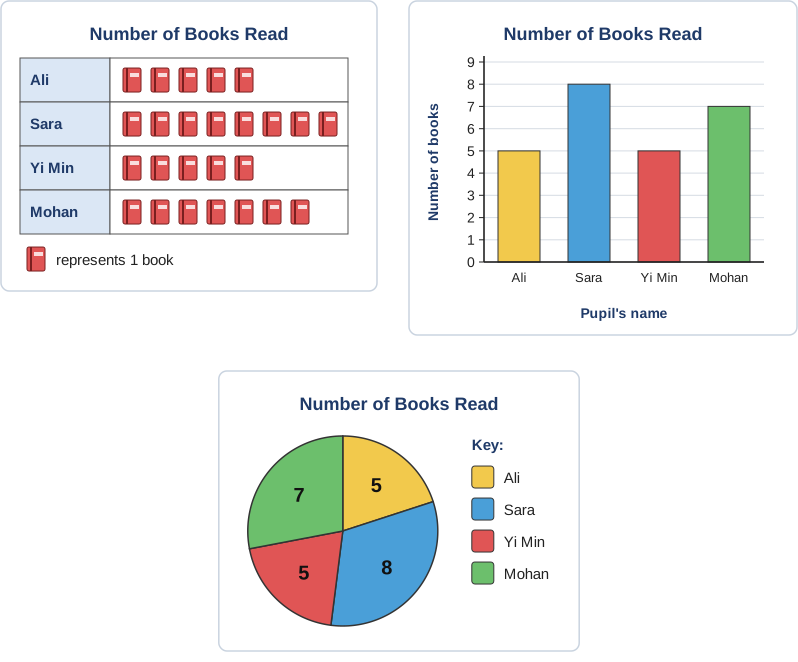
- Pictograph: Sara has the most pictures. 8 pictures × 1 book = 8 books.
- Bar chart: Sara's bar is the highest. It reaches 8.
- Pie chart: the largest part is 8. The key shows it is Sara.
- All three charts agree: Sara reads the most books.
The charts also show that Ali and Yi Min read the same number of books, which is 5. In the pictograph they have the same number of pictures. In the bar chart their bars are the same height. In the pie chart their parts are the same size.
Show answerHide answer
9.4Solving problems with data
To solve a data problem: read the question, find the numbers in the table or chart, then calculate if you need to.
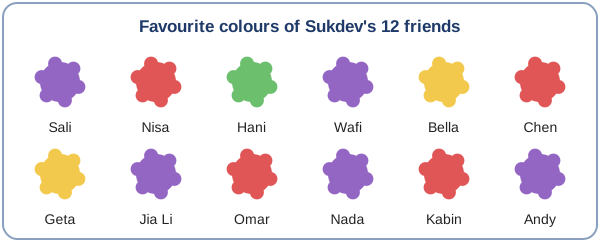
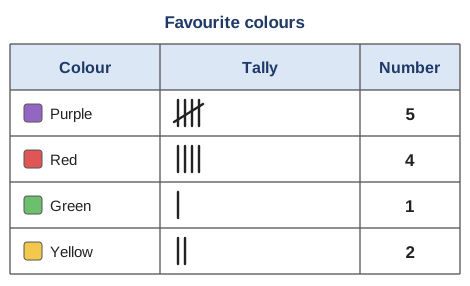
- Classify and sort the data in a tally table.
- Count: purple 5, red 4, green 1, yellow 2. Check: 5 + 4 + 1 + 2 = 12 friends.
- The smallest number is 1. The least favoured colour is green.
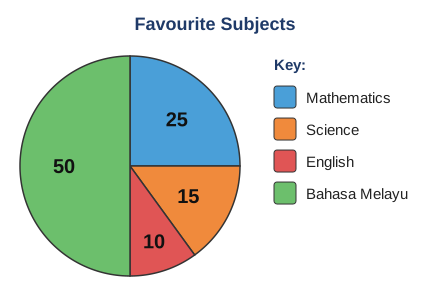
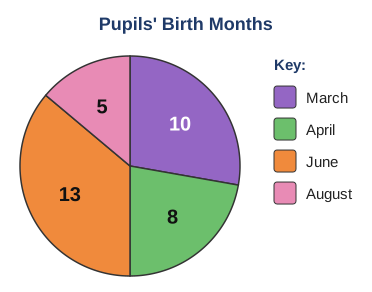
- How many pupils like Mathematics? The key shows Mathematics is blue. The blue part says 25.
- Which subject is the most favoured? The green part is the largest (50). The key shows green is Bahasa Melayu.
- How many more pupils like Bahasa Melayu than English? 50 − 10 = 40 pupils.
- Check the total: 25 + 15 + 10 + 50 = 100 pupils. Correct!
Sometimes one picture in a pictograph stands for more than one thing. Always read the key first!
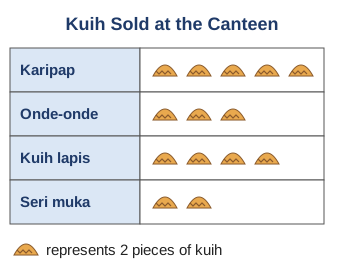
- The key: 1 picture = 2 pieces of kuih.
- Karipap: 5 × 2 = 10. Onde-onde: 3 × 2 = 6. Kuih lapis: 4 × 2 = 8. Seri muka: 2 × 2 = 4.
- Altogether: 10 + 6 + 8 + 4 = 28 pieces of kuih.
Show answerHide answer
Summary
| Remember | Key fact |
|---|---|
| Data | Information we collect by watching, asking or using a form |
| Classify and sort | Put the same things in one group, then arrange them in a table |
| Tally | One stick for each thing. The 5th stick goes across: a group of 5. Count in fives. |
| Check | The numbers in the table add up to the number of data collected |
| Pie chart | Data in a circle. Largest part = the most. Smallest part = the least. Read the key. |
| Three charts | Most pictures = highest bar = largest part. They can show the same data. |
| Pictograph key | If 1 picture = 2, multiply the number of pictures by 2 |