Mathematics questions, unit 9
Nama / NameKelas / ClassTarikh / Date
Data
30 marks. Use Practice to check each answer as you go, or Exam to answer everything first. Before you answer, read the title and the key of every chart.
Section A: objective questions
8 marksChoose the best answer for each question.
1
Question 1
Which chart shows data as parts of a circle?
Show answerHide answer
C
A pie chart is a circle cut into parts. A bigger part means a bigger number.
2
Question 2
Diagram 1 shows some tally marks. What number do they show?

Show answerHide answer
D
The gate is a group of 5. Then there are 3 more sticks. 5 + 3 = 8. Counting the gate as 4 gives 7; counting it as 6 gives 9.
3
Question 3
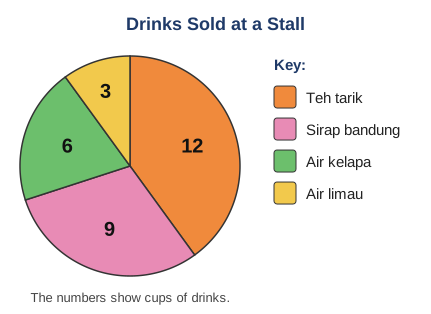
Diagram 2 shows the drinks sold at a pasar malam stall. Which drink was sold the most?
Show answerHide answer
A
The largest part is 12. The key shows it is teh tarik. Air limau (3) is the smallest part, so it was sold the least.
4
Question 4
Look at Diagram 2. How many cups of air kelapa were sold?
Show answerHide answer
B
The key shows air kelapa is green. The green part says 6.
5
Question 5
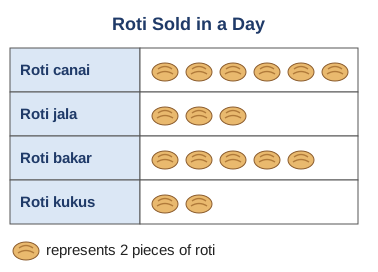
Diagram 3 shows the roti sold at a stall in one day. How many pieces of roti canai were sold?
Show answerHide answer
B
One picture = 2 pieces. Roti canai has 6 pictures. 6 × 2 = 12. The answer 6 counts the pictures only.
6
Question 6
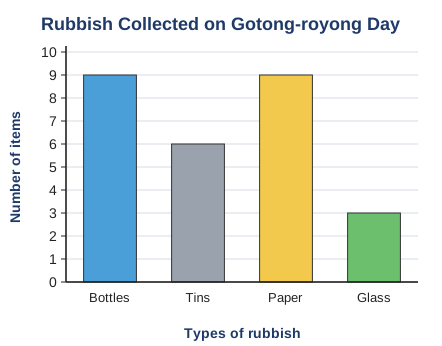
Diagram 4 shows the rubbish collected on gotong-royong day. Which two types of rubbish have the same number?
Show answerHide answer
A
The bars for bottles and paper are the same height. Both reach 9.
7
Question 7
Look at Diagram 3 again. How many more pieces of roti canai than roti kukus were sold?
Show answerHide answer
D
Roti canai: 6 × 2 = 12. Roti kukus: 2 × 2 = 4. 12 − 4 = 8. The answer 4 is the difference in pictures, and 16 is the sum.
8
Question 8
Look at Diagram 2 again. Which sentence is true?
Show answerHide answer
C
Teh tarik 12 + air kelapa 6 = 18 cups, so C is true. Air limau is the smallest part, so it was sold the least, not the most. Sirap bandung (9) is not the least. The total is 12 + 9 + 6 + 3 = 30 cups, not 25.
Section B: structured questions
22 marksAnswer all questions. Show how you find each answer.
9
Question 9
Choose the correct answer.
[1 mark]
(a)In a bar chart, the item with the most is shown by the ______ bar.
Show answerHide answer
highest
The highest (or longest) bar shows the biggest number.
[1 mark]
(b)In a pie chart, the item with the least is shown by the ______ part.
Show answerHide answer
smallest
The smallest part shows the smallest number.
10
Question 10
Mira asked her friends about their favourite fruit. This is her data:
durian, banana, apple, durian, rambutan, banana, durian, apple, durian, rambutan, durian, banana, apple, durian, rambutan, banana
Classify and sort the data in a tally table like this:
durian, banana, apple, durian, rambutan, banana, durian, apple, durian, rambutan, durian, banana, apple, durian, rambutan, banana
Classify and sort the data in a tally table like this:
| Fruit | Tally | Number |
|---|---|---|
| Durian | ||
| Banana | ||
| Apple | ||
| Rambutan |
[1 mark]
(a)How many friends chose durian? Draw its tally.
Show answerHide answer
Tick each point you got.
[1 mark]
(b)How many friends chose banana?
Show answerHide answer
Tick each point you got.
[1 mark]
(c)Which fruit is the most favoured?
Show answerHide answer
Tick each point you got.
[1 mark]
(d)How many friends did Mira ask altogether? Show your working.
Show answerHide answer
Tick each point you got.
11
Question 11
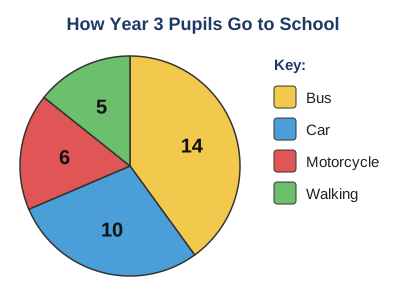
Diagram 5 shows how the Year 3 pupils of SK Taman Melati go to school.
[1 mark]
(a)How many pupils walk to school?
Show answerHide answer
Tick each point you got.
[1 mark]
(b)How do most pupils go to school?
Show answerHide answer
Tick each point you got.
[1 mark]
(c)How many more pupils go by bus than by car?
Show answerHide answer
Tick each point you got.
12
Question 12
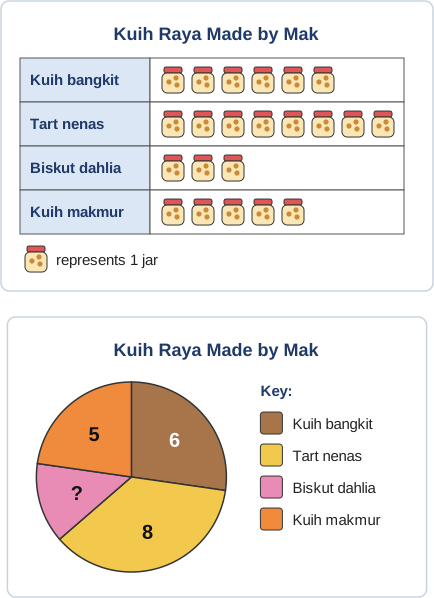
Diagram 6 shows a pictograph and a pie chart of the same data. Mak made kuih raya for Hari Raya.
[1 mark]
(a)What is the number in the part marked ? in the pie chart?
Show answerHide answer
Tick each point you got.
[1 mark]
(b)Which kuih did Mak make the most? Give a reason from the pie chart.
Show answerHide answer
Tick each point you got.
[1 mark]
(c)How many jars of kuih raya did Mak make altogether?
Show answerHide answer
Tick each point you got.
13
Question 13
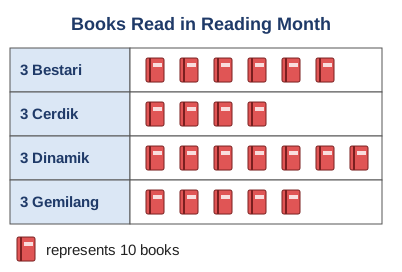
Diagram 7 shows the number of books read by four Year 3 classes in Reading Month.
[1 mark]
(a)How many books did 3 Dinamik read?
Show answerHide answer
Tick each point you got.
[2 marks]
(b)How many books did the four classes read altogether? Show your working.
Show answerHide answer
Tick each point you got.
14
Question 14
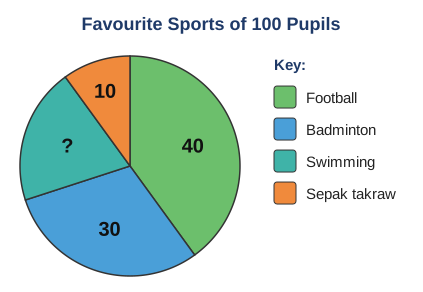
Diagram 8 shows the favourite sports of 100 pupils. The number of pupils who like swimming is hidden.
[2 marks]
(a)How many pupils like swimming? Show your working.
Show answerHide answer
Tick each point you got.
[1 mark]
(b)Arrange the sports from the most favoured to the least favoured.
Show answerHide answer
Tick each point you got.
15
Question 15
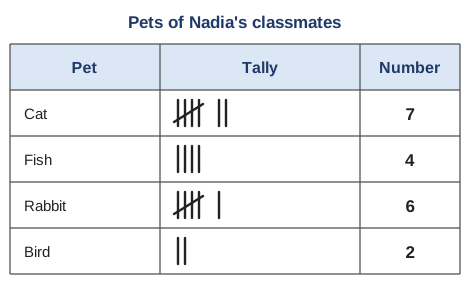
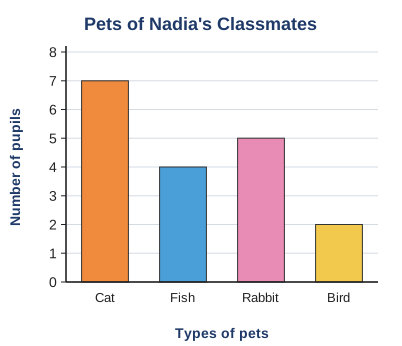
Nadia made a tally table of her classmates' pets (Diagram 9). Then she drew a bar chart from it (Diagram 10). She made one mistake in the bar chart.
[1 mark]
(a)Which bar is wrong?
Show answerHide answer
Rabbit
The tally shows 6 rabbits, but the bar only reaches 5.
[1 mark]
(b)Explain how Nadia should correct her mistake.
Show answerHide answer
Tick each point you got.
16
Question 16
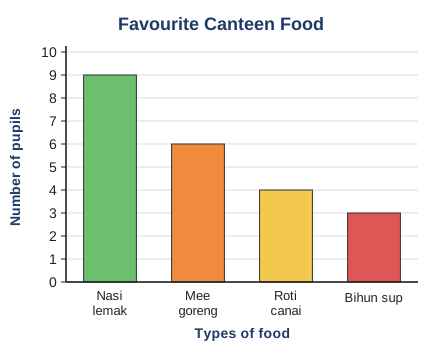
Diagram 11 shows the favourite canteen food of some Year 3 pupils.
[2 marks]
(a)Write one question that your friend can answer using the bar chart. Then write its answer.
Show answerHide answer
Tick each point you got.