Mathematics questions, unit 8
Nama / NameKelas / ClassTarikh / Date
Data Handling
40 marks. Use Practice to check each answer as you go, or Exam to answer everything first.
Section A: objective questions
8 marksChoose the correct answer.
1
Question 1
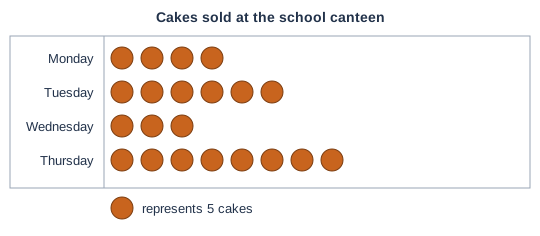
Diagram 1 shows the cakes sold at the school canteen. How many cakes were sold on Thursday?
Show answerHide answer
C
Thursday has 8 symbols. Each symbol is 5 cakes, so 8 × 5 = 40 cakes.
2
Question 2
Look at Diagram 1 again. On which day were the fewest cakes sold?
Show answerHide answer
A
Wednesday has the fewest symbols (3), so it has the fewest cakes (15).
3
Question 3
Look at Diagram 1 again. What is the total number of cakes sold in the four days?
Show answerHide answer
B
Symbols: 4 + 6 + 3 + 8 = 21. Cakes: 21 × 5 = 105. (21 is only the number of symbols.)
4
Question 4
A teacher wants to draw a bar chart for the data 20, 40, 60 and 80. Which scale on the vertical axis is the most suitable?
Show answerHide answer
D
The scale must go up in equal steps and be big enough for 80. Counting in 20s is suitable. Counting in 1s needs too many lines, and counting in 100s makes the bars too short. 0, 3, 7, 12 is not equal steps.
5
Question 5
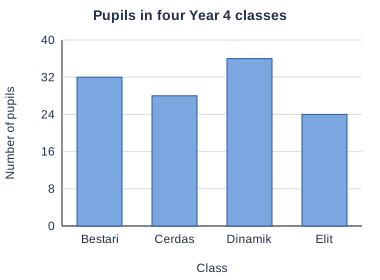
Diagram 2 shows the number of pupils in four Year 4 classes. How many more pupils are in the biggest class than in the smallest class?
Show answerHide answer
B
The biggest class is Dinamik (36) and the smallest is Elit (24). 36 − 24 = 12.
6
Question 6
Look at Diagram 2 again. What is the percentage of pupils who are in class Elit?
Show answerHide answer
D
Total = 32 + 28 + 36 + 24 = 120. Elit: 24 ÷ 120 × 100% = 20%.
7
Question 7
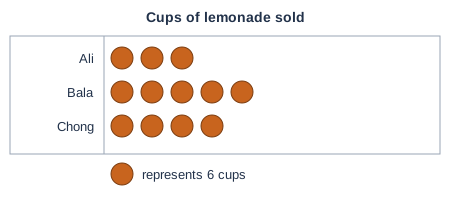
Diagram 3 shows the lemonade sold by three children. Which statement is true?
Show answerHide answer
C
Chong has 4 symbols, 4 × 6 = 24 cups. Ali sold 3 × 6 = 18, not 3. Bala sold 30 and Ali 18, which is not double. The total is 12 × 6 = 72, not 60.
8
Question 8
In Diagram 2, 6 pupils move from class Dinamik to class Elit. Which statement is correct after the move?
Show answerHide answer
A
Dinamik becomes 36 − 6 = 30 and Elit becomes 24 + 6 = 30, so they are equal. Bestari (32) is then the biggest.
Section B: structured questions
32 marksAnswer all questions. Show your working.
9
Question 9
Four children own toy cars. Aiman has 15, Bee has 20, Cathy has 10 and Dev has 25. Wenn draws a pictograph. One symbol represents 5 toy cars.
[2 marks]
(a)How many symbols are drawn for Aiman and for Dev?
Show answerHide answer
Tick each point you got.
[1 mark]
(b)Eli has 30 toy cars. How many symbols are drawn for Eli?
Show answerHide answer
Tick each point you got.
[1 mark]
(c)Wenn changes the key to 1 symbol represents 10 toy cars. How should Dev's 25 toy cars be shown?
Show answerHide answer
Tick each point you got.
10
Question 10
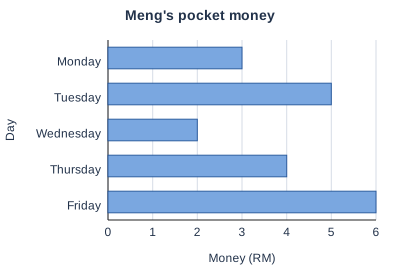
Diagram 4 shows Meng's pocket money for five days.
[1 mark]
(a)On which day did Meng get the most pocket money?
Show answerHide answer
Friday
The Friday bar is the longest, RM6.
[1 mark]
(b)How much pocket money did Meng get in the five days?
Show answerHide answer
Tick each point you got.
[1 mark]
(c)Find the difference between the pocket money on Tuesday and on Wednesday.
Show answerHide answer
Tick each point you got.
[1 mark]
(d)On which two days is the total pocket money RM10?
Show answerHide answer
Tick each point you got.
11
Question 11
Diagram 5 is an incomplete pictograph of the trees in an orchard. There are 100 trees in all.
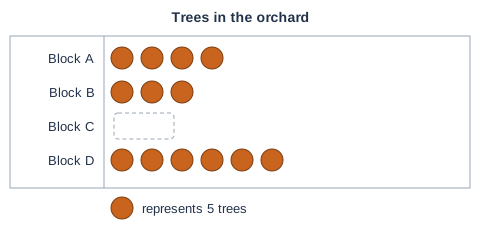
[2 marks]
(a)How many symbols must be drawn for Block C?
Show answerHide answer
Tick each point you got.
[1 mark]
(b)How many trees are in Block B?
Show answerHide answer
Tick each point you got.
[1 mark]
(c)What is the percentage of trees in Block D?
Show answerHide answer
Tick each point you got.
12
Question 12
Diagram 6 shows the favourite drinks of the pupils in a group.
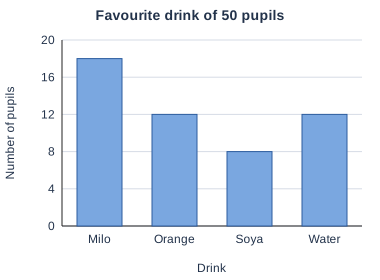
[1 mark]
(a)How many pupils are in the group?
Show answerHide answer
Tick each point you got.
[2 marks]
(b)What is the percentage of pupils who like Milo?
Show answerHide answer
Tick each point you got.
[1 mark]
(c)How many more pupils like Milo than soya?
Show answerHide answer
Tick each point you got.
13
Question 13
Diagram 7 shows Siti's marks in four science tests, each out of 10. The bar for the fifth test, Earth, is not drawn yet. To get a badge, Siti must score more than 38 marks in total for the five tests.
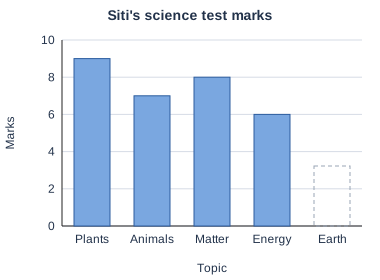
[1 mark]
(a)What is her total mark for the four tests?
Show answerHide answer
Tick each point you got.
[2 marks]
(b)She scores 8 marks in the Earth test. Does she get the badge? Explain.
Show answerHide answer
Tick each point you got.
[1 mark]
(c)What is the lowest mark she needed in the Earth test to get the badge?
Show answerHide answer
Tick each point you got.
14
Question 14
There are 60 members in four school clubs. Drama has 15 members and Music has 9 members. Chess has 6 more members than Art.
[1 mark]
(a)How many members are in Art and Chess together?
Show answerHide answer
Tick each point you got.
[2 marks]
(b)How many members are in Art? How many are in Chess?
Show answerHide answer
Tick each point you got.
[1 mark]
(c)A bar chart is drawn for the four clubs. Which scale is the most suitable for the vertical axis?
Show answerHide answer
Count in 5s
The biggest number is 21, so counting in 5s up to 25 fits and is easy to read.
15
Question 15
Look at Diagram 1 again (cakes sold at the canteen; each symbol represents 5 cakes). Hana says the total number of cakes sold is 100. Ravi says the cakes sold on Thursday are twice the cakes sold on Monday.
[1 mark]
(a)Is Hana correct?
Show answerHide answer
No
The total is 21 symbols × 5 = 105, not 100.
[2 marks]
(b)Show how you know.
Show answerHide answer
Tick each point you got.
[1 mark]
(c)Is Ravi correct? Explain.
Show answerHide answer
Tick each point you got.
16
Question 16
A teacher asks 51 pupils for their favourite sport: football 12, badminton 18, swimming 6 and hockey 15. You will draw a pictograph for this data.
[1 mark]
(a)Write a suitable key: 1 symbol represents ______ pupils.
Show answerHide answer
Tick each point you got.
[2 marks]
(b)Using your key, how many symbols are drawn for each sport?
Show answerHide answer
Tick each point you got.
[1 mark]
(c)Write one sentence about the favourite sport using your pictograph.
Show answerHide answer
Tick each point you got.