Mathematics notes, unit 8
Data Handling
Textbook Mathematics Year 4 (DLP), pages 233-242
What this chapter covers
- You can construct a pictograph, with a key, from a set of data (8.1.1)
- You can construct vertical and horizontal bar charts, choosing a suitable scale (8.1.1)
- You can read and interpret pictographs and bar charts, and compare, add and subtract the values (8.1.2)
- You can solve problems using the information in a pictograph or a bar chart, including percentages (8.2.1)
8.1Constructing pictographs
Data is a set of facts, such as how many marbles each friend has. A pictograph and a bar chart show data so that it is quick to read and compare.
A pictograph uses a symbol to stand for a number of things. The key tells us what one symbol represents. Every pictograph needs a title, a key and a symbol for each item.
| Name | Hana | Ivan | Jun | Kavi |
|---|---|---|---|---|
| Number of marbles | 8 | 12 | 10 | 6 |
Worked example: draw a pictograph for the marbles
Step 1. Draw 2 columns and 4 rows. Write the names in the left column.Step 2. Choose the key. All the numbers are even, so let 1 symbol represent 2 marbles.
Step 3. Divide each number by the key: Hana 8 ÷ 2 = 4, Ivan 12 ÷ 2 = 6, Jun 10 ÷ 2 = 5, Kavi 6 ÷ 2 = 3.
Step 4. Draw that many symbols in each row. Write the title and the key.
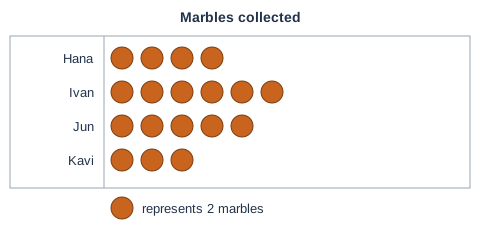
Choose a key that divides every number in the data. A key of 2 or 5 or 10 is easy to count in. A half symbol stands for half of the key: if the key is 10, a half symbol is 5.
Do not forget the key. Without it, nobody knows what a symbol is worth. Also, draw every symbol the same size.
Hari has 15 stickers. The key says 1 symbol represents 5 stickers. How many symbols are needed?
Show answerHide answer
15 ÷ 5 = 3 symbols.
8.2Constructing bar charts
A bar chart uses bars of equal width. The height (or length) of a bar shows the value. A bar chart has a title, a horizontal axis, a vertical axis, a scale and a label on each axis.
Worked example: draw a vertical bar chart for the marbles
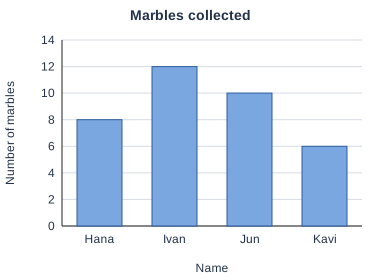
Step 1. Draw the horizontal axis and the vertical axis.Step 2. Write the names along the horizontal axis.
Step 3. Choose the scale on the vertical axis. The biggest number is 12, so go up to 14 in steps of 2: 0, 2, 4, 6 … 14.
Step 4. Draw one bar for each name, with the height of its number.
Step 5. Write the title and label both axes.
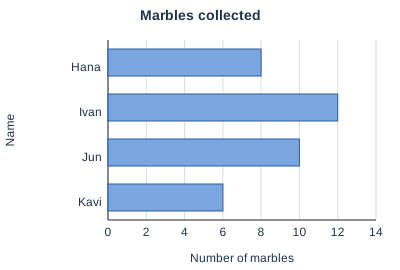
We can swap the axes to make a horizontal bar chart. The names go down the left side and the bars go to the right.
| Data | Suitable scale |
|---|---|
| 8, 12, 10, 6 | count in 2s |
| 45, 60, 30, 75 | count in 15s or 5s |
| 120, 160, 140, 180 | count in 20s |
The scale must go up in equal steps and must start at 0. Do not use 0, 2, 4, 10, 20. Also, the scale must be big enough for the biggest number.
Four teams score 80, 90, 75 and 85 points. Which scale is suitable: count in 1s, count in 10s, or count in 100s?
Show answerHide answer
Count in 10s (0, 10, 20 … 90). Counting in 1s needs too many lines, and counting in 100s makes all the bars look the same.
8.3Interpreting pictographs and bar charts
To interpret a chart means to read it and say what it tells us. First read the title, then the key or the scale. Then work out the value of each symbol or bar.
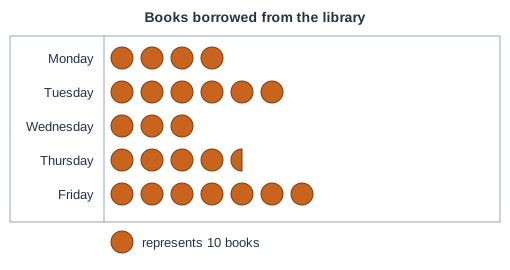
Worked example: read the pictograph above
Step 1. Value of each day: Monday 4 × 10 = 40, Tuesday 60, Wednesday 30, Thursday 4½ × 10 = 45, Friday 70.Step 2. The most books were borrowed on Friday (70). The fewest were borrowed on Wednesday (30).
Step 3. Difference between Friday and Wednesday: 70 − 30 = 40 books.
Step 4. Total: 40 + 60 + 30 + 45 + 70 = 245 books.
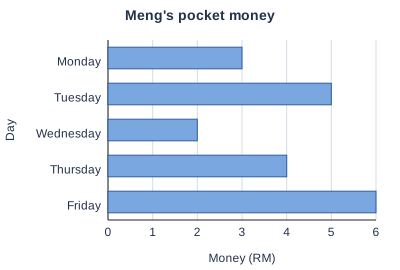
- Meng's pocket money on Thursday is RM4.
- The most pocket money is on Friday, RM6.
- The difference between Tuesday and Wednesday is RM5 − RM2 = RM3.
- The total for five days is 3 + 5 + 2 + 4 + 6 = RM20.
Always multiply by the key. Wednesday has 3 symbols but borrowed 30 books, not 3.
Look at the pocket money chart. On which day is the pocket money RM2 less than on Thursday?
Show answerHide answer
Thursday is RM4, so RM4 − RM2 = RM2. That is Wednesday.
8.4Solving problems
Problem 1: a missing number of symbols
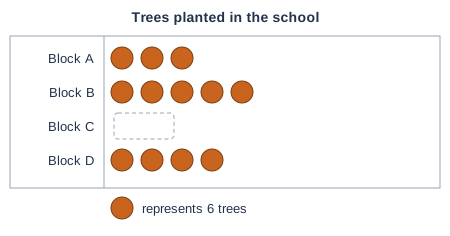
Step 1. Total symbols = 90 ÷ 6 = 15.
Step 2. Symbols shown = 3 + 5 + 4 = 12.
Step 3. Block C = 15 − 12 = 3 symbols (3 × 6 = 18 trees).
Check: 12 + 3 = 15 symbols, and 15 × 6 = 90. ✓
Problem 2: percentage from a bar chart
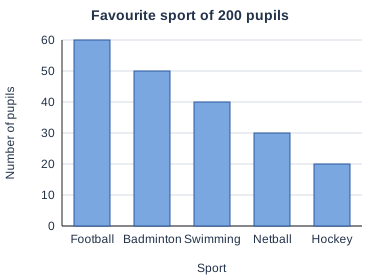
Step 1. Total number of pupils = 60 + 50 + 40 + 30 + 20 = 200.
Step 2. Swimming = 40 out of 200.
Step 3. Percentage = 40 ÷ 200 × 100% = 20%.
Check: 20% of 200 = 20 ÷ 100 × 200 = 40. ✓
Percentage = (the part ÷ the total) × 100%. First add up the whole chart to get the total.
Use the sports bar chart. What percentage of the pupils like football?
Show answerHide answer
60 ÷ 200 × 100% = 30%.
Summary
| Remember | Key fact |
|---|---|
| Pictograph | Needs a title, a key and equal symbols. Value = number of symbols × key. |
| Half symbol | Stands for half of the key |
| Bar chart | Bars of equal width, a scale that starts at 0, a title and labels on both axes |
| Vertical or horizontal | The same data can be drawn either way |
| Interpreting | Read the title and the key or scale, find each value, then compare, add or subtract |
| Percentage | part ÷ total × 100% |