Scientific skills
What this chapter covers
- {'You can use the six skills you met in Year 3 together': 'observing, classifying, measuring and using numbers, making inferences, predicting and communicating (1.1.1 to 1.1.6)'}
- You can describe how things change over time using the space-time relationship (1.1.7)
- You can interpret data in tables, charts and graphs (1.1.8)
- You can define a concept operationally by what you measure or observe (1.1.9)
- You can name the manipulated, responding and constant variables in an investigation (1.1.10)
- You can make a hypothesis that links the manipulated and the responding variable (1.1.11)
- You can plan and carry out a fair experiment, from problem statement to conclusion and report (1.1.12)
Scientists follow careful ways of thinking to find out about the world. These are the science process skills. In Year 3 you learned six of them. In Year 4 you use those six and learn six more. Together they help you plan a fair test and explain what you find.
1.1Science process skills
Skills from Year 3
A group of pupils clean up a rubbish area and use the first six skills without noticing.
| Skill | What you do | Example from the clean-up |
|---|---|---|
| Observing | Use your senses to get information. | The rubbish increases each day and the smell is unpleasant. |
| Classifying | Sort things into groups by what they share. | Paper, glass, metal and plastic are collected separately. |
| Measuring and using numbers | Use tools and standard units. | The cans are weighed before they are sold. |
| Making inferences | Give a sensible reason for an observation. | Food leftovers rot in the soil, so the smell goes away when they are buried. |
| Predicting | Say what will happen next, using clues. | At RM4.00 per kilogram, 2 kg of cans will sell for RM8.00. |
| Communicating | Share information in words, tables, charts or drawings. | The pupils record and present what they found. |
Textbook pp.2–3.
Using space-time relationship
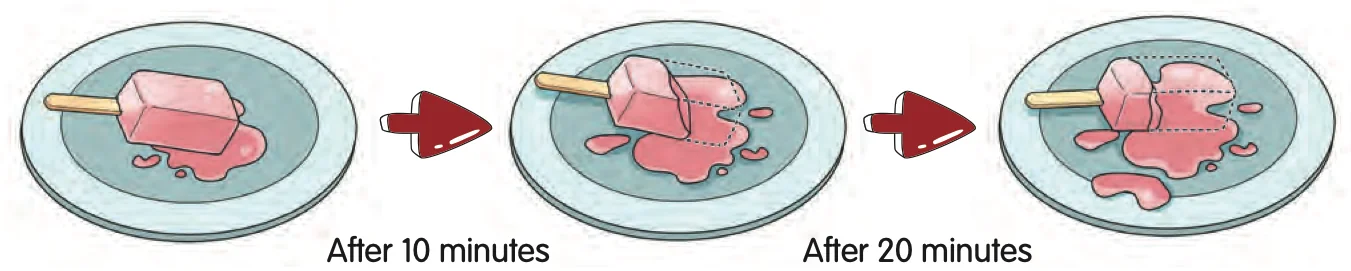
Textbook p.6.
Say it as a sentence: as time increases, the shape of the popsicle becomes irregular and its size decreases.
Show answerHide answer
Interpreting data
Fariz and his friends counted the birds at three bird feeders for five days.
| Bird feeder | Day 1 | Day 2 | Day 3 | Day 4 | Day 5 | Total |
|---|---|---|---|---|---|---|
| A | 4 | 8 | 7 | 9 | 5 | 33 |
| B | 2 | 4 | 5 | 5 | 4 | 20 |
| C | 3 | 6 | 8 | 7 | 2 | 26 |
Data from textbook p.8.
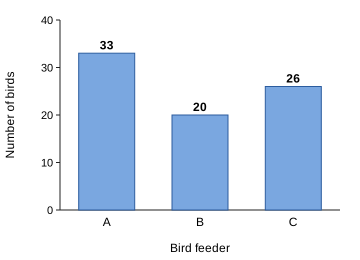
Interpretations: most birds visited feeder A (33); feeder B was visited least (20). Pie charts, bar charts and classification charts can all be interpreted in the same way: find the biggest, the smallest and the differences.
Show answerHide answer
Defining operationally
Siva and Teruni soak three tissue papers in 50 mℓ of water for one minute and measure the water left in each beaker. The more water the paper absorbs, the less water is left.
- Operational definition of the ability to absorb water: the volume of water left in the beaker.
- Operational definition of the most absorbent material: the one with the least volume of water left.
Textbook pp.10–11.
Controlling variables
| Variable | Meaning | Fariz and Mei Lan's plants |
|---|---|---|
| Manipulated | The one you change on purpose. | The volume of water used to water the plant |
| Responding | The one you observe or measure. It changes because of the manipulated variable. | The size of the plant |
| Constant (fixed) | The ones you keep the same. | Amount of sunlight, type of soil, quantity of soil |
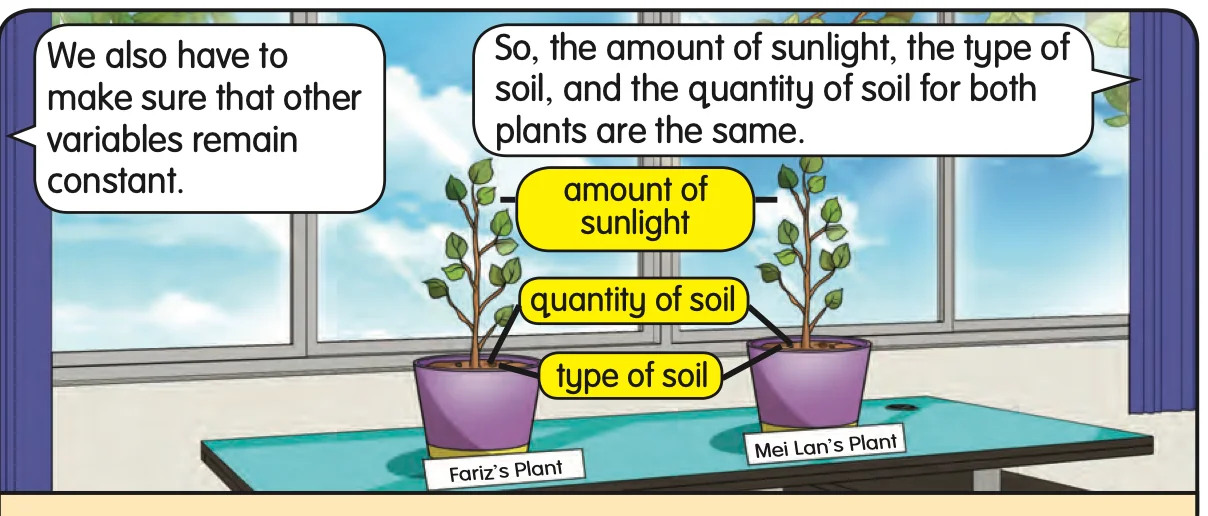
Textbook pp.12–13.
Show answerHide answer
Making a hypothesis
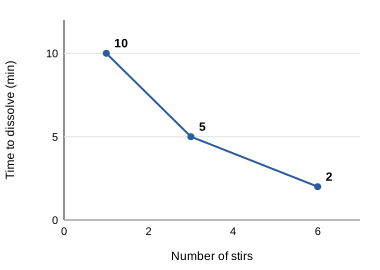
Mei Lan and Fariz wonder if stirring changes how fast sugar dissolves. Their hypothesis is: the more the number of stirs, the less the time taken for the sugar to dissolve completely.
Example: As the volume of water increases, the height of the plant increases.
Textbook p.15.
Experimenting
The sugar investigation shows every stage in order:
- Problem statement: Does the number of stirs affect the time taken for the sugar to dissolve completely?
- Hypothesis: the more the number of stirs, the less the time taken.
- Controlling variables: manipulated is the number of stirs; responding is the time to dissolve; constant are the quantity and size of the sugar and the volume and temperature of the water.
- Apparatus and materials: 3 beakers, 3 spoons of sugar, 300 mℓ warm water, stopwatch, glass rod.
- Steps: 100 mℓ warm water in each of beakers A, B and C; one spoon of sugar in each; stir A once, B three times and C six times per minute; record the time.
- Collect and interpret data in a table.
- Conclusion: accept or do not accept the hypothesis.
- Report: write an experimental report.
| Beaker | Number of stirs | Time taken to dissolve completely (minutes) |
|---|---|---|
| A | 1 | 10 |
| B | 3 | 5 |
| C | 6 | 2 |
Textbook pp.16–19.
Show answerHide answer
Which skill is it?
| Skill | Remember it as |
|---|---|
| Using space-time relationship | What changes as time passes? |
| Interpreting data | What do the numbers tell us? |
| Defining operationally | What do we measure or observe? |
| Controlling variables | Change one, measure one, keep the rest the same. |
| Making a hypothesis | As X increases, Y increases or decreases. |
| Experimenting | Plan, test, conclude, report. |