Mathematics questions, unit 8
Nama / NameKelas / ClassTarikh / Date
Data Handling
43 marks. Use Practice to check each answer as you go, or Exam to answer everything first.
Section A: objective questions
10 marksChoose the correct answer.
1
Question 1
Which word means the value that appears most often in a set of data?
Show answerHide answer
C
The mode is the value with the highest frequency. The range is the difference between the biggest and smallest values, the median is the middle value and the mean is the average.
2
Question 2
What is the range of the data 14, 9, 21, 12, 17?
Show answerHide answer
A
Range = maximum value − minimum value = 21 − 9 = 12.
3
Question 3
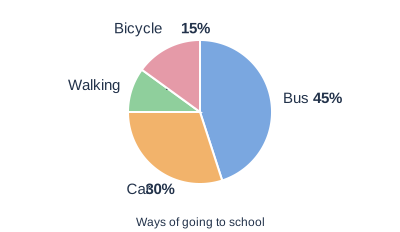
Diagram 1 shows how pupils go to school. What is the percentage of pupils who walk?
Show answerHide answer
D
A pie chart totals 100%. 45% + 30% + 15% = 90%, so walking is 100% − 90% = 10%.
4
Question 4
What is the mean of 6, 8, 9, 5 and 12?
Show answerHide answer
B
Total = 6 + 8 + 9 + 5 + 12 = 40. Mean = 40 ÷ 5 = 8. (40 is the total, not the mean.)
5
Question 5
What is the median of 12, 7, 15, 9, 10 and 20?
Show answerHide answer
C
In order: 7, 9, 10, 12, 15, 20. There are 6 values, so the median is the mean of the 3rd and 4th values: (10 + 12) ÷ 2 = 11.
6
Question 6
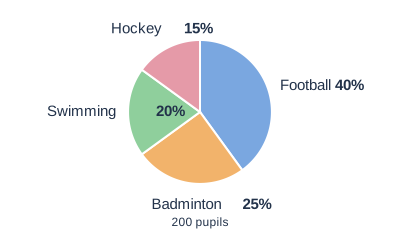
Diagram 2 shows the favourite sports of 200 pupils. How many pupils like hockey?
Show answerHide answer
A
15% of 200 = 15 ÷ 100 × 200 = 30 pupils. (15 is the percentage, not the number of pupils.)
7
Question 7
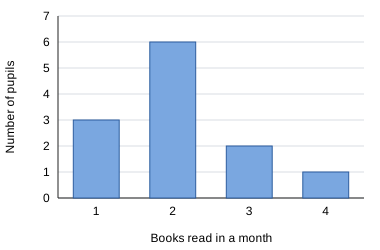
The bar chart in Diagram 3 shows the number of books read by 12 pupils in a month. What is the mode?
Show answerHide answer
B
The tallest bar is for 2 books, with 6 pupils. The mode is the value 2 books, not the frequency 6.
8
Question 8
The table shows the number of goals scored by 10 pupils in a game.
What is the mean number of goals?
| Goals | 1 | 2 | 3 | 4 |
|---|---|---|---|---|
| Number of pupils | 2 | 4 | 3 | 1 |
Show answerHide answer
B
Total goals = 1×2 + 2×4 + 3×3 + 4×1 = 2 + 8 + 9 + 4 = 23. Mean = 23 ÷ 10 = 2.3.
9
Question 9
The mean of five numbers is 11. Four of the numbers are 10, 14, 9 and 15. What is the fifth number?
Show answerHide answer
D
Total of five numbers = 5 × 11 = 55. The four numbers add up to 10 + 14 + 9 + 15 = 48. The fifth number is 55 − 48 = 7.
10
Question 10
The data 4, 7, 7, 8, 9 has a new value, 10, added to it. Which one of these does not change?
Show answerHide answer
A
The mode stays 7. The median changes from 7 to 7.5, the mean from 7 to 7.5 (45 ÷ 6), and the range from 5 to 6.
Section B: structured questions
33 marksAnswer all questions. Show your working.
11
Question 11
The numbers of goals scored by a team in seven matches are: 8, 11, 8, 14, 9, 8, 12.
[1 mark]
(a)What is the frequency of 8?
Show answerHide answer
Tick each point you got.
[1 mark]
(b)State the mode.
Show answerHide answer
Tick each point you got.
[1 mark]
(c)State the range.
Show answerHide answer
Tick each point you got.
12
Question 12
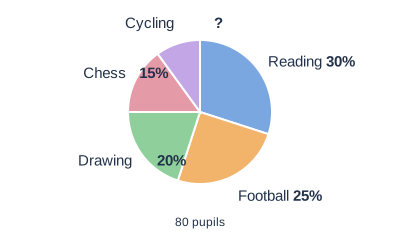
Diagram 4 shows how 80 pupils spend their free time.
[1 mark]
(a)What is the percentage of pupils who like cycling?
Show answerHide answer
Tick each point you got.
[2 marks]
(b)How many pupils like the most popular activity?
Show answerHide answer
Tick each point you got.
[1 mark]
(c)Find the difference in the number of pupils between drawing and chess.
Show answerHide answer
Tick each point you got.
13
Question 13
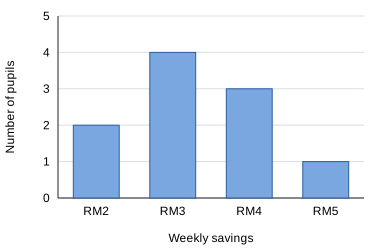
The bar chart in Diagram 5 shows the weekly savings of 10 pupils.
[1 mark]
(a)State the mode.
Show answerHide answer
Tick each point you got.
[1 mark]
(b)Calculate the range.
Show answerHide answer
Tick each point you got.
[2 marks]
(c)Find the median.
Show answerHide answer
Tick each point you got.
[2 marks]
(d)Calculate the mean.
Show answerHide answer
Tick each point you got.
14
Question 14
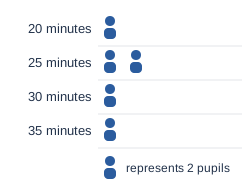
The pictograph in Diagram 6 shows the time some pupils practise the piano each day.
[1 mark]
(a)How many pupils practise for 25 minutes?
Show answerHide answer
Tick each point you got.
[2 marks]
(b)State the mode and the range.
Show answerHide answer
Tick each point you got.
[2 marks]
(c)Calculate the mean time.
Show answerHide answer
Tick each point you got.
15
Question 15
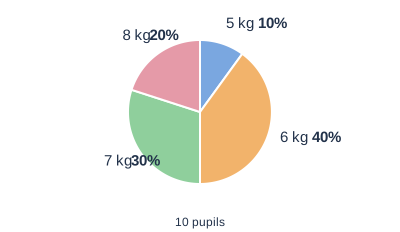
The pie chart in Diagram 7 shows the mass of newspapers gathered by 10 pupils for recycling.
[1 mark]
(a)How many pupils gathered 7 kg?
Show answerHide answer
Tick each point you got.
[1 mark]
(b)State the mode.
Show answerHide answer
Tick each point you got.
[1 mark]
(c)Find the median.
Show answerHide answer
Tick each point you got.
[2 marks]
(d)Calculate the mean mass.
Show answerHide answer
Tick each point you got.
16
Question 16
Aini scored 72, 85, 90 and 77 marks in four Mathematics tests.
[2 marks]
(a)Calculate her mean mark.
Show answerHide answer
Tick each point you got.
[2 marks]
(b)She wants a mean of 84 after the fifth test. What mark must she score in the fifth test?
Show answerHide answer
Tick each point you got.
17
Question 17
The table shows the number of brothers and sisters of 10 pupils.
Hana says, "The median is 1, because 1 has the highest frequency."
| Number of brothers and sisters | 1 | 2 | 3 | 4 |
|---|---|---|---|---|
| Number of pupils | 4 | 2 | 3 | 1 |
[1 mark]
(a)State the mode.
Show answerHide answer
Tick each point you got.
[2 marks]
(b)Is Hana correct? Prove it.
Show answerHide answer
Tick each point you got.
18
Question 18
Write a set of five numbers with a mode of 4, a median of 5 and a range of 6.
[3 marks]
(a)Write your five numbers and show that they fit.
Show answerHide answer
Tick each point you got.