Mathematics notes, unit 8
Data Handling
Textbook Mathematics Year 5 (DLP), Part 1 and Part 2, pages Part 2, 251–264
What this chapter covers
- You can read a pie chart and find a missing percentage so that the total is 100% (8.1.1)
- You can find the number of pupils for a sector by taking its percentage of the total (8.1.1)
- You can find the percentage of a group by writing it as a fraction and multiplying by 100% (8.1.1)
- You can state the frequency, mode and range of a set of data (8.2.1)
- You can find the median, and the mean, of data given as a list, a table, a pictograph, a bar chart or a pie chart (8.2.1)
- You can solve problems about data by choosing the right measure and showing your working (8.3.1)
Data handling is about collecting facts and then making sense of them. In Year 5 you read pie charts and find four numbers that describe a set of data: the mode, the range, the median and the mean.
8.1Interpreting pie charts
A pie chart shows data as a circle. Each sector is a part of the whole, shown as a percentage. The percentages in a pie chart must add up to 100%.
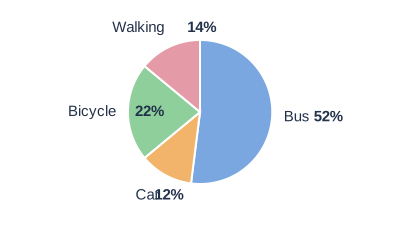
From the pie chart we can say that more than half of the pupils (52%) come by bus. The difference between the pupils who come by car and by bicycle is 22% − 12% = 10%.
Finding a missing percentage
Worked example: 80 pupils choose a game
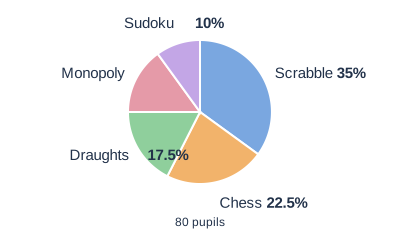
Step 2. Take the total away from 100%: 100% − 85% = 15%. Monopoly is 15%.
Finding the number of pupils
To find the number for a sector, take the sector's percentage of the total: number = percentage ÷ 100 × total.
Worked example: use the same pie chart
Scrabble is the highest at 35%: 35 ÷ 100 × 80 = 28 pupils.Sudoku is 10%: 10 ÷ 100 × 80 = 8 pupils.
Finding the percentage
Worked example: 6 out of 30 pupils like comics
Percentage = 6 ÷ 30 × 100% = 20%. (Textbook p.253.)A pie chart shows percentages, not numbers. Do not write "35 pupils" for 35%. The number of pupils depends on the total: 35% of 80 pupils is 28, but 35% of 200 pupils is 70.
Check a missing sector by adding all the sectors again. If the total is not 100%, something is wrong.
A pie chart of 50 pupils shows: football 40%, swimming 30%, badminton 20% and hockey. (a) What percentage play hockey? (b) How many pupils play swimming?
Show answerHide answer
(a) 40% + 30% + 20% = 90%, so hockey is 100% − 90% = 10%. (b) 30 ÷ 100 × 50 = 15 pupils.
8.2Mode, range, median and mean
| Word | What it means | How to find it |
|---|---|---|
| Frequency | How many times a value appears | Count the value |
| Mode | The value with the highest frequency | Find the tallest bar or the most common value |
| Range | How spread out the data is | Maximum value − minimum value |
| Median | The middle value when the data is in ascending (or descending) order | Arrange the data, then take the middle one |
| Mean | The average | Total value ÷ number of data |
Mode, range and frequency
Worked example: 11 donors give money to charity
RM10 (1 donor), RM12 (4 donors), RM15 (3 donors), RM20 (2 donors), RM25 (1 donor).The frequency of RM12 is 4. It is the highest, so the mode is RM12.
Range = RM25 − RM10 = RM15. (Textbook p.254.)
The mode is the value that appears most often, not the frequency. In the example, the mode is RM12, not 4.
Median and mean from a list or a pictograph
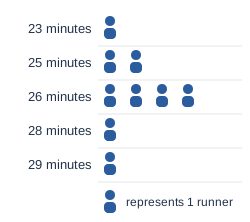
Worked example: median and mean of the nine times
Step 1. Arrange in ascending order: 23, 25, 25, 26, 26, 26, 26, 28, 29.Step 2. There are 9 values, so the median is the 5th one: 26 minutes.
Step 3. Total time = 23 + 2 × 25 + 4 × 26 + 28 + 29 = 234 minutes.
Step 4. Mean = 234 ÷ 9 = 26 minutes.
Mode = 26 minutes. Range = 29 − 23 = 6 minutes.
From a bar chart
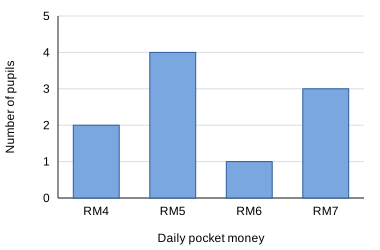
Worked example
Mode: the tallest bar is RM5 (4 pupils), so the mode is RM5.Range = RM7 − RM4 = RM3.
Median: 10 values, so use the 5th and 6th values. In order they are RM4, RM4, RM5, RM5, RM5, RM5, RM6, RM7, RM7, RM7. Both middle values are RM5, so the median is (RM5 + RM5) ÷ 2 = RM5.
Mean = (2 × 4 + 4 × 5 + 1 × 6 + 3 × 7) ÷ 10 = 55 ÷ 10 = RM5.50.
Median. If the number of values is odd, the median is the middle value. If it is even, there are two middle values: add them and divide by 2.
From a pie chart
First change each percentage to a number of pupils. Then carry on as with a table.
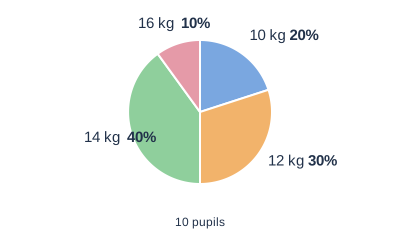
| Mass | 10 kg | 12 kg | 14 kg | 16 kg |
|---|---|---|---|---|
| Percentage | 20% | 30% | 40% | 10% |
| Number of pupils | 20 ÷ 100 × 10 = 2 | 3 | 4 | 1 |
Worked example
Mode = 14 kg (4 pupils). Range = 16 − 10 = 6 kg.Median: the 5th and 6th values are 12 kg and 14 kg, so the median = (12 + 14) ÷ 2 = 13 kg.
Mean = (2 × 10 + 3 × 12 + 4 × 14 + 1 × 16) ÷ 10 = 128 ÷ 10 = 12.8 kg.
Always arrange the data in order before finding the median. The middle of an unordered list is not the median. Also remember to divide the mean by the number of data, which is the total of the frequencies, not the number of different values.
Find the mode, range, median and mean of: 6, 9, 4, 9, 7, 10, 9, 5.
Show answerHide answer
In order: 4, 5, 6, 7, 9, 9, 9, 10. Mode = 9. Range = 10 − 4 = 6. Median = (7 + 9) ÷ 2 = 8. Mean = 59 ÷ 8 = 7.375.
8.3Solving problems about data
The textbook solves problems in three steps: understand the problem, plan the strategy, then solve. Check your answer at the end. In data problems the plan is usually: find the data in the chart or table, put it in ascending order, then calculate what is asked.
Worked example: heights of 10 pupils (textbook p.259)
Heights in metres: 1.25, 1.25, 1.25, 1.30, 1.15, 1.30, 1.25, 1.25, 1.30, 1.25.In order: 1.15, 1.25 (six times), 1.30 (three times).
Range = 1.30 − 1.15 = 0.15 m. Mode = 1.25 m (6 pupils). Median = the 5th and 6th values = (1.25 + 1.25) ÷ 2 = 1.25 m.
Worked example: jelly sweets in a container (textbook p.261)
Kiwi 20, mango 13, grape 25, strawberry 22. Total = 20 + 13 + 25 + 22 = 80.Percentage of kiwi = 20 ÷ 80 × 100% = 25%.
Mean of each flavour = 80 ÷ 4 = 20.
Finding a missing value from the mean. Total = mean × number of data. For a mean of 84 over 5 tests, the total must be 5 × 84 = 420. Subtract the marks you already have to find the missing one.
Aina's marks in four tests are 70, 80, 85 and 77. (a) What is her mean mark? (b) What mark must she score in the fifth test for a mean of 80?
Show answerHide answer
(a) 70 + 80 + 85 + 77 = 312, and 312 ÷ 4 = 78. (b) 5 × 80 = 400, and 400 − 312 = 88.