Scientific skills
What this chapter covers
- You can use the twelve science process skills to find out about things (1.1.1 to 1.1.12)
- You can tell the difference between an observation, an inference and a prediction (1.1.1, 1.1.4, 1.1.5)
- You can read tables, charts and graphs and use them to communicate and interpret data (1.1.6, 1.1.8)
- You can identify the manipulated, responding and constant variables in an investigation (1.1.10)
- You can write a hypothesis and an operational definition (1.1.9, 1.1.11)
- You can describe the steps of a fair test and write a conclusion (1.1.12)
In Year 5 you use twelve science process skills to solve problems. Six are the skills you learned in Year 3. The other six are: using space-time relationship, interpreting data, defining operationally, controlling variables, making a hypothesis and experimenting. Together they let you plan and carry out a fair test.
1.1Science process skills
The first six skills
| Skill | What it means | Example from the paper plane competition |
|---|---|---|
| Observing | Using the senses to collect information | The nose cone of Ana's plane is long and pointed. |
| Classifying | Sorting things into groups by a characteristic | Planes sorted by the size of their wings. |
| Measuring and using numbers | Using tools and standard units | The plane travelled 450 cm (a sample result, measured with a measuring tape). |
| Making inferences | Giving a sensible reason for an observation | Maybe the plane flew far because its wings are large. |
| Predicting | Saying what will happen next, using evidence or a pattern | "I predict your plane will fly far because of its large wings." |
| Communicating | Sharing information in a table, chart, graph, drawing or words | A table of the distance for each stretch. |
Inferring. Observation: large logs float on water. Inference: they are less dense than water. Observation: the rate of breathing is higher after exercise. Inference: the body needs more oxygen.
Predicting: Pupil A rides a motorcycle and Pupil B cycles, over the same 1 km. Prediction: Pupil A will take a shorter time than Pupil B.
Litmus paper: an alkali turns red litmus paper blue. A substance that turns blue litmus paper red is an acid. A substance that changes neither paper is neutral.
Using space-time relationship
Example: a seedling grows taller and taller as the days pass, so its height changes with time. A bubble that is bigger takes a longer time to burst.
"The height of the plant increases from 4 cm to 7 cm after 2 days."
Interpreting data
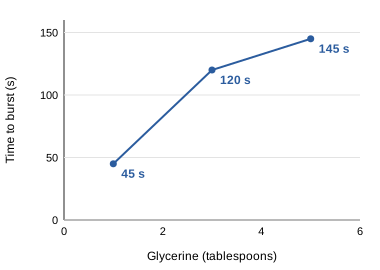
Look at the glycerine results. The more glycerine there is, the longer the time.
| Quantity of glycerine (tablespoons) | Time for the bubble to burst (s) |
|---|---|
| 1 | 45 |
| 3 | 120 |
| 5 | 145 |
Show answerHide answer
Variables and controlling variables
A variable is something that can change in an investigation. There are three kinds.
| Variable | Meaning | Paper plane investigation |
|---|---|---|
| Manipulated (changed) | The one thing you change on purpose | Length of the stretched rubber band (10, 20, 30 cm) |
| Responding (measured) | What changes because of it; you measure it | Distance travelled by the paper plane |
| Constant (fixed) | Everything else, kept the same | Type, size and thickness of the paper; the folding design |
Mr Zaki gave every pupil the same type of paper, so the size and thickness were the same too. The type, size and thickness of the paper are constant variables that make the test fair.
Show answerHide answer
Making a hypothesis
Model: The more (or less, longer, higher) the manipulated variable, the more (or less, longer, higher) the responding variable.
Defining operationally
| Thing to define | Operational definition |
|---|---|
| Durability of the soap bubbles | The time taken for the soap bubbles to burst. |
| Distance travelled by the paper plane | The length from the starting point to where the plane lands, measured with a measuring tape. |
| An alkali | A substance that turns red litmus paper blue. |
Experimenting
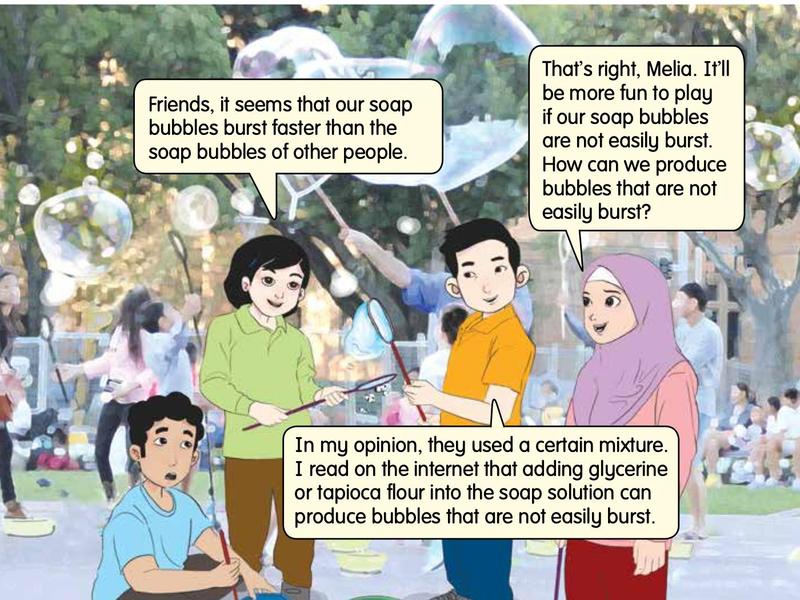
Use these steps in order, as Ana and her friends did for the soap bubbles.
- Aim: "To investigate the relationship between the quantity of glycerine and the time taken for the soap bubbles to burst."
- Problem statement: "Does a different quantity of glycerine affect the time taken for the soap bubbles to burst?"
- Hypothesis: the more glycerine, the longer the time.
- Variables: manipulated, responding, constant.
- Apparatus and materials: safety goggles, measuring cylinder, stopwatch, plastic container with a lid, drinking straw, tablespoon, water, dishwashing liquid, glycerine.
- Steps: a clear list in order, repeated for each value of the manipulated variable.
- Data: a table of results.
- Analysing the data: say what the table shows.
- Conclusion: say if the hypothesis is accepted or not accepted.
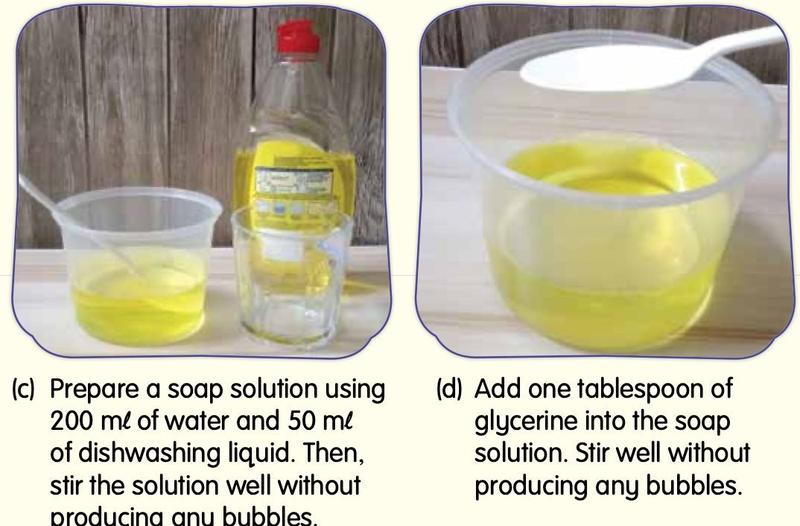
The result was 45 s for 1 tablespoon, 120 s for 3 tablespoons and 145 s for 5 tablespoons. The conclusion: the hypothesis is accepted. The higher the quantity of glycerine, the longer the time taken for the soap bubble to burst.
1.2Science process skills in solving problems
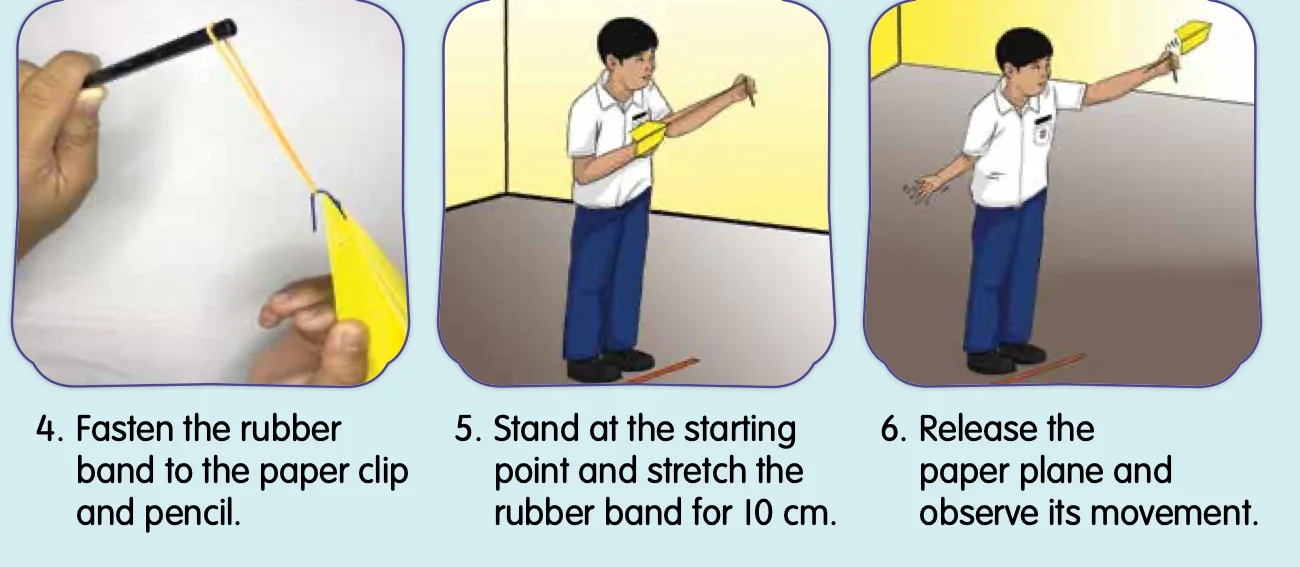
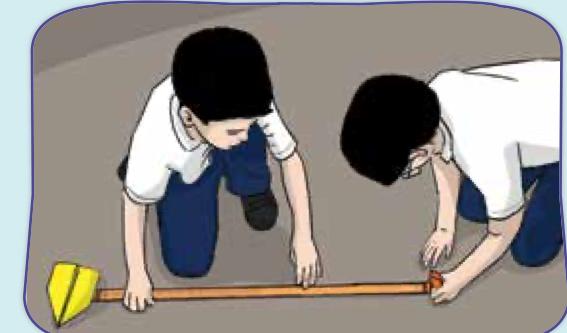
Scientists do not use the skills one by one. They use many together. Look at the paper plane investigation.
| Step | Skill used |
|---|---|
| Look at the plane in flight | Observing |
| Say why it flew farther | Making inferences |
| Stretch the rubber band 10, 20 and 30 cm | Controlling variables (manipulated) |
| Measure the distance with a tape | Measuring and using numbers |
| Record in a table or chart | Communicating |
| State that the farther the stretch, the farther the plane flies | Making a hypothesis / interpreting data |
Manipulated: length of stretched rubber band. Responding: distance travelled by the plane. Constant: the same plane, the same paper clip, the same pupil launching.
Relationship: the longer the stretched rubber band, the farther the plane travels (expected).
Show answerHide answer
Show answerHide answer

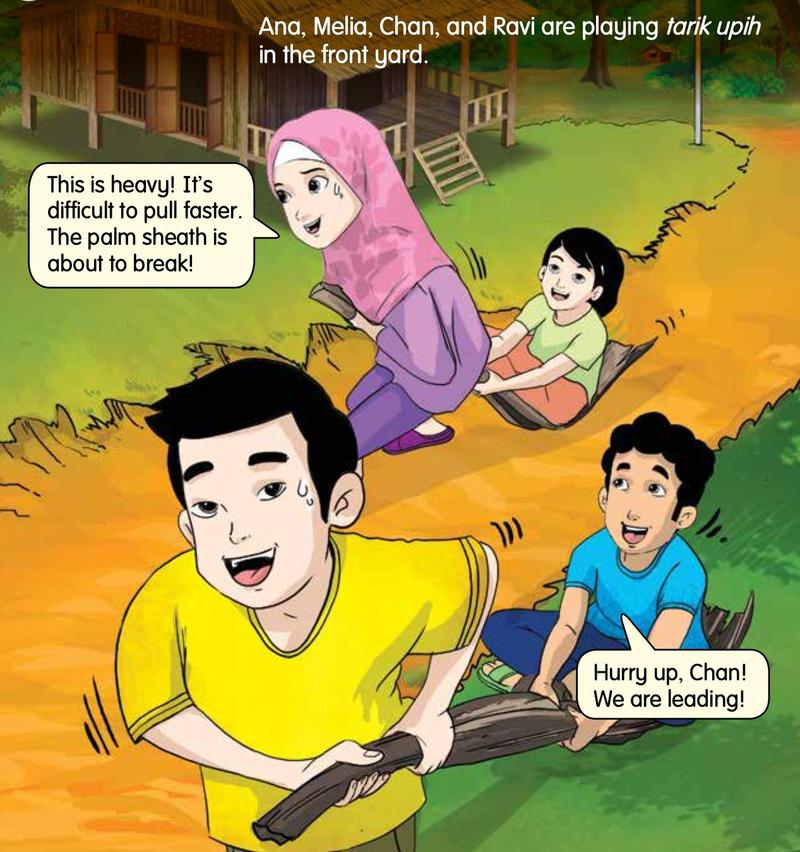
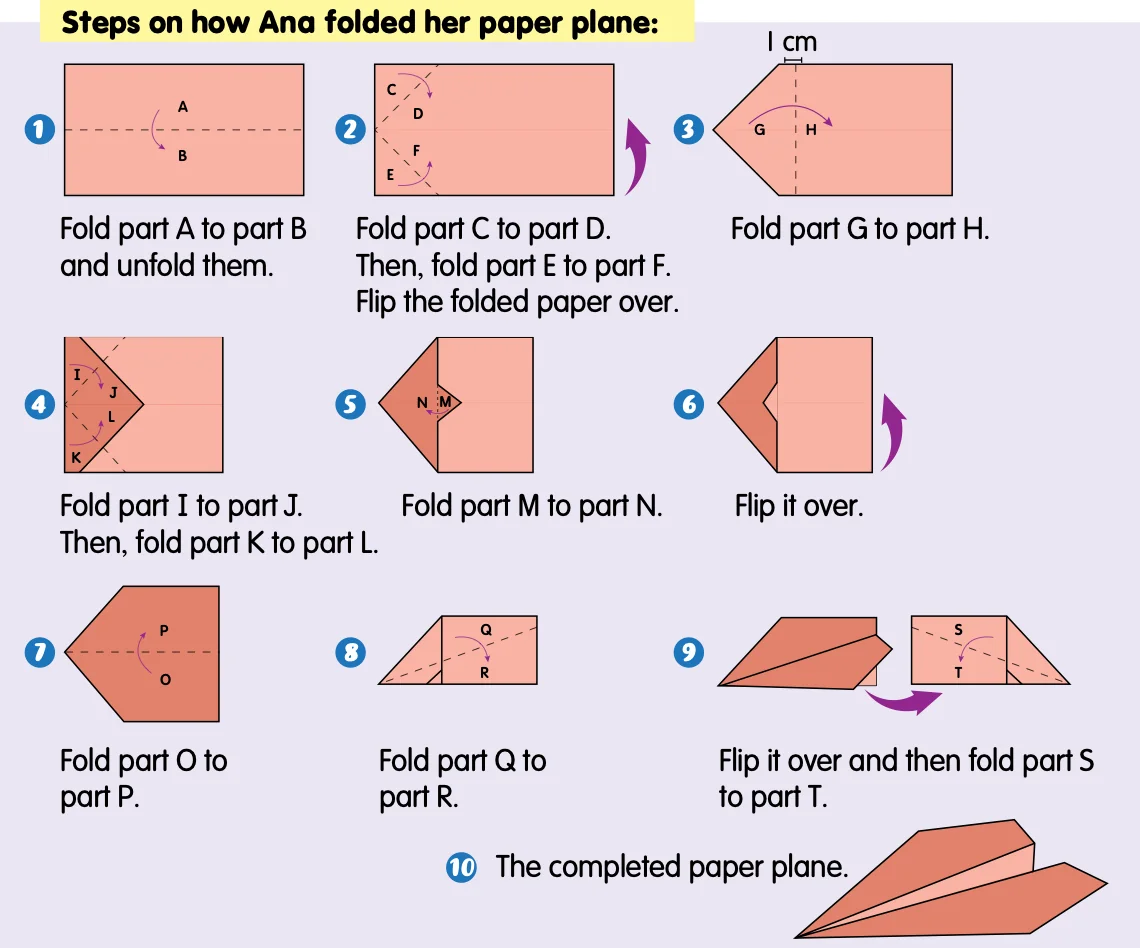
Pictures: Science Year 5 (DLP) textbook, pp. 1–18 (tarik upih p. 1, folding steps p. 2, rubber band steps p. 6, measuring p. 7, soap bubbles p. 8, soap solution p. 10, breathing p. 15). Line graph drawn for this site from the textbook table on p. 13.
Summary
| Skill | In one line |
|---|---|
| Observing | Use the senses to collect information. |
| Classifying | Group by a shared characteristic. |
| Measuring and using numbers | Numbers with standard units. |
| Making inferences | Sensible reason for an observation. |
| Predicting | What will happen next, from evidence. |
| Communicating | Share with tables, charts, graphs, words. |
| Using space-time relationship | How something changes with time. |
| Interpreting data | Explain patterns in a table or graph. |
| Defining operationally | Say what you do and measure. |
| Controlling variables | Change one thing, keep the rest the same. |
| Making a hypothesis | The more X, the more Y (testable). |
| Experimenting | Carry out a fair test and conclude. |