Mathematics questions, unit 8
Nama / NameKelas / ClassTarikh / Date
Data Handling and Likelihood
43 marks. Use Practice to check each answer as you go, or Exam to answer everything first.
Section A: objective questions
10 marksChoose the correct answer.
1
Question 1
Which angle in a pie chart stands for half of the whole circle?
Show answerHide answer
C
A whole circle is 360°. Half of 360° is 180°.
2
Question 2
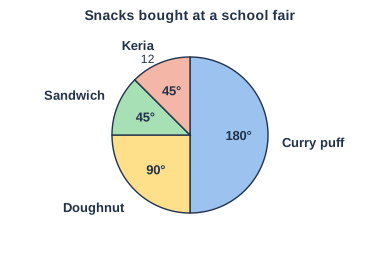
Diagram 1 shows snacks bought at a school fair. 12 pupils bought keria. How many snacks were bought altogether?
Show answerHide answer
B
45° is 1/8 of the circle and stands for 12. The whole circle is 8 × 12 = 96.
3
Question 3
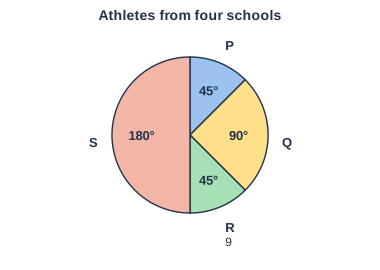
Diagram 2 shows the athletes from four schools. School R has 9 athletes. How many athletes are from school Q?
Show answerHide answer
D
R has 45° = 9 athletes. Q has 90°, which is twice 45°, so 2 × 9 = 18.
4
Question 4
A sea turtle climbs a tree. What is the likelihood of this event?
Show answerHide answer
A
A sea turtle cannot climb a tree, so it can never happen: impossible.
5
Question 5
A dice is rolled. What is the likelihood that the number is even?
Show answerHide answer
B
The even numbers are 2, 4 and 6 (3 numbers) and the odd numbers are 1, 3 and 5 (3 numbers). The chances are the same: equally likely.
6
Question 6
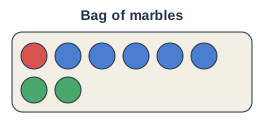
Diagram 3 shows the marbles in a bag. One marble is picked without looking. Which statement is correct?
Show answerHide answer
D
There are 5 blue marbles and only 2 green marbles, so blue is more likely than green.
7
Question 7
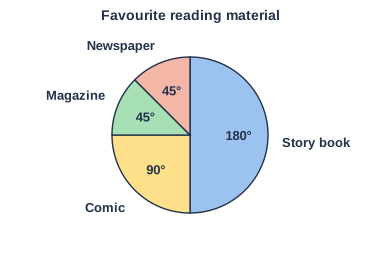
Diagram 4 shows the reading materials that 40 pupils like best. Which statement is true?
Show answerHide answer
A
Magazine and newspaper both have 45°, so they have equal numbers (5 each). The story book has the largest angle, and the comic is the second largest.
8
Question 8
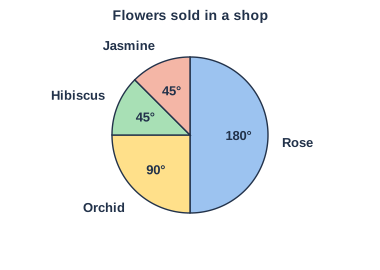
Diagram 5 shows the flowers sold in a shop. The shop sold 40 roses. How many hibiscus flowers were sold?
Show answerHide answer
C
Rose: 180° = 40. Then 90° = 20 and 45° = 10. Hibiscus has 45°, so 10 flowers.
9
Question 9
A box has 3 yellow cubes and 3 green cubes. What can be done to make picking a green cube more likely?
Show answerHide answer
C
Adding 1 green cube gives 4 green and 3 yellow, so green is more likely. Taking out a green cube or adding a yellow one makes green less likely, and swapping yellow for yellow changes nothing.
10
Question 10
Which set of angles cannot be the slices of one pie chart?
Show answerHide answer
D
The slices of a pie chart must total 360°. 180° + 90° + 90° + 45° = 405°, which is too much. The other sets each make 360°.
Section B: structured questions
33 marksAnswer all questions. Show your working.
11
Question 11
40 pupils chose their favourite sport: football 20, badminton 10, hockey 5, table tennis 5. The data will be shown in a pie chart.
[1 mark]
(a)Football has 20 pupils out of 40. What fraction of the circle is football?
Show answerHide answer
Tick each point you got.
[1 mark]
(b)What angle stands for football?
Show answerHide answer
Tick each point you got.
[1 mark]
(c)What angle stands for hockey?
Show answerHide answer
Tick each point you got.
[1 mark]
(d)Which sport has the most pupils?
Show answerHide answer
Football
The sport with the most data has the largest angle, which is football with 20 pupils.
12
Question 12
Diagram 6 shows the number of athletes from four schools. School R has 9 athletes.
[1 mark]
(a)How many athletes are from school S?
Show answerHide answer
Tick each point you got.
[2 marks]
(b)What is the total number of athletes?
Show answerHide answer
Tick each point you got.
[2 marks]
(c)Find the difference between the number of athletes from schools S and P.
Show answerHide answer
Tick each point you got.
13
Question 13
Diagram 7 shows the snacks bought at a school fair. 12 pupils bought keria.
[2 marks]
(a)How many curry puffs were bought?
Show answerHide answer
Tick each point you got.
[1 mark]
(b)How many doughnuts were bought?
Show answerHide answer
Tick each point you got.
[1 mark]
(c)What fraction of all the snacks is doughnuts?
Show answerHide answer
Tick each point you got.
14
Question 14
24 pupils chose their favourite pet: cat 12, rabbit 6, fish 3, bird 3. Write the angle for each pet in a pie chart.
[1 mark]
(a)Cat
Show answerHide answer
Tick each point you got.
[1 mark]
(b)Rabbit
Show answerHide answer
Tick each point you got.
[1 mark]
(c)Fish (the angle for bird is the same)
Show answerHide answer
Tick each point you got.
15
Question 15
Diagram 8 shows the marbles in a bag. Rina picks one marble without looking.
[2 marks]
(a)State the likelihood of picking a red marble. Give a reason.
Show answerHide answer
Tick each point you got.
[1 mark]
(b)Which colour is the most likely to be picked?
Show answerHide answer
Blue
Blue has 5 marbles, more than any other colour.
[1 mark]
(c)Picking a yellow marble is
Show answerHide answer
impossible
There is no yellow marble in the bag.
16
Question 16
Choose the likelihood of each event.
[1 mark]
(a)A heptagon has nine sides.
Show answerHide answer
impossible
A heptagon always has seven sides.
[1 mark]
(b)A tossed coin shows a tail.
Show answerHide answer
equally likely
A coin has one head and one tail, so both are as likely.
[1 mark]
(c)There are seven days in a week.
Show answerHide answer
certain
A week always has seven days.
17
Question 17
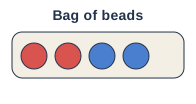
Diagram 9 shows a bag of beads. Hadi picks one bead without looking.
[2 marks]
(a)State the likelihood of picking a red bead. Give a reason.
Show answerHide answer
Tick each point you got.
[1 mark]
(b)Hadi adds 3 blue beads to the bag. Picking a red bead is now
Show answerHide answer
less likely
Now 2 red and 5 blue beads, so red is less likely.
18
Question 18
Farid says: "In a pie chart, 90° means there are 90 pupils."
[1 mark]
(a)Is Farid correct?
Show answerHide answer
No
An angle shows a fraction of the whole, not a count.
[2 marks]
(b)Explain your answer. Use the fact that a circle is 360°.
Show answerHide answer
Tick each point you got.
19
Question 19
32 pupils each chose one favourite drink from four drinks. The pie chart for the data uses only 180°, 90°, 45° and 45°.
[2 marks]
(a)Write a possible table of drinks and the number of pupils for each. The numbers must add up to 32.
Show answerHide answer
Tick each point you got.
[2 marks]
(b)Write the angle for each drink in your table.
Show answerHide answer
Tick each point you got.