Scientific skills
What this chapter covers
- You can name the twelve science process skills and say what each one means (1.1.1 to 1.1.12)
- You can tell the difference between an observation, an inference and a prediction (1.1.1, 1.1.4, 1.1.5)
- You can read a table and a bar chart and use them to communicate and interpret data (1.1.6, 1.1.8)
- You can identify the manipulated, responding and constant variables in an experiment (1.1.10)
- You can write a hypothesis and an operational definition (1.1.9, 1.1.11)
- You can plan a fair test with the report format and write a conclusion (1.1.12)
In Year 6 you meet the science process skills again, this time in one big investigation: Raju, Alia, Chua and Jesy build a balloon car and find out what makes it travel far. Watch how many skills they use without even noticing!
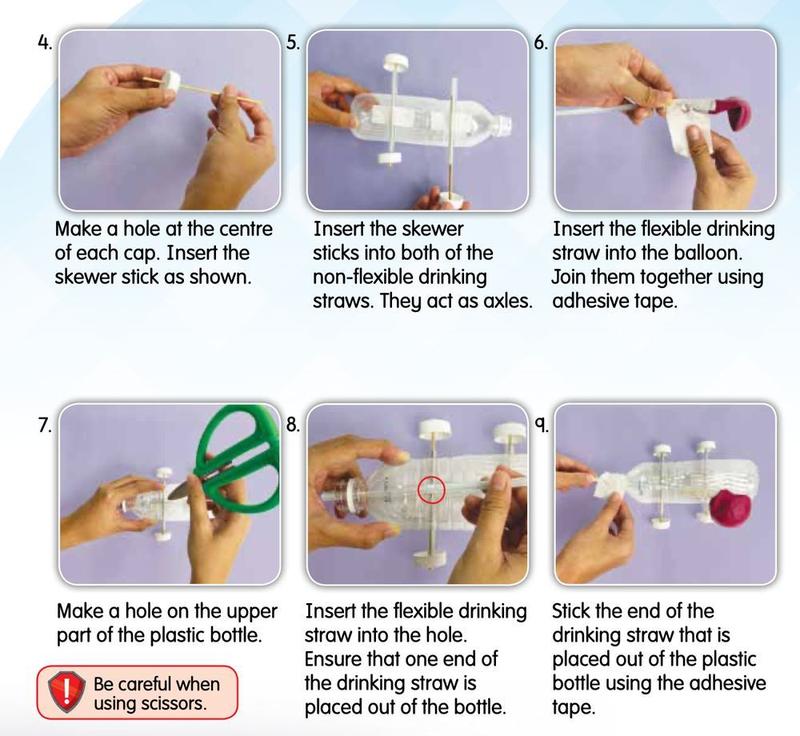
Pictures: Science Year 6 (DLP) textbook, pp. 3 to 12 (car steps p. 3, balloons p. 4, table p. 6, Magic Water p. 9, Mind Test pp. 11 to 12). Graphs are drawn for this site.
1.1The twelve science process skills
| Skill | What it means | Balloon car example |
|---|---|---|
| Observing | Using the senses to collect information | The size of the balloon becomes smaller as the car moves. |
| Classifying | Sorting things into groups by a common characteristic | All the balloon cars have a bottle body, four bottle-cap wheels and a balloon. These common characteristics put them in one group. |
| Measuring and using numbers | Using tools and standard units | Chua's car travelled 38 cm, measured with a ruler. |
| Making inferences | Giving a sensible reason for an observation | Alia's car went the shortest distance because her balloon is small and holds the least air. |
| Predicting | Saying what will happen next, using evidence or a pattern | "I predict that the lighter the car, the farther it will travel." |
| Communicating | Sharing information in a table, chart, graph, drawing or words | The distance of each car is written in a table. |
| Using space-time relationship | Describing how something changes as time passes | The balloon gets smaller in time as the car moves. |
| Interpreting data | Explaining what the data in a table or graph show, and the pattern | Chua's car travelled the farthest, then Raju's, then Alia's. |
| Defining operationally | Defining a thing by what it does or how you measure it in the investigation | The winning car is the one that travels the longest distance on the ruler. |
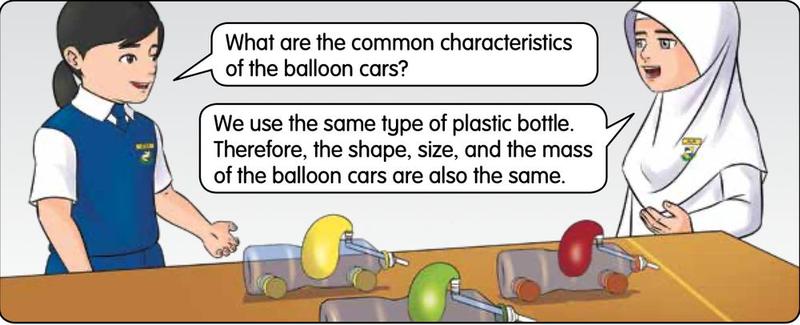
| Controlling variables | Changing one variable and keeping the others the same | Same bottle, so the shape, size and mass of the cars are the same. |
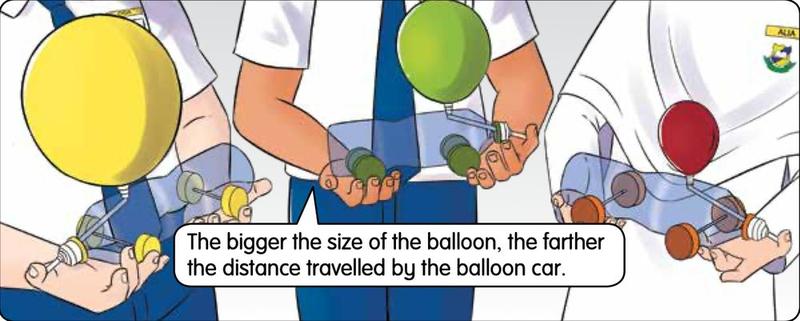
| Making a hypothesis | A statement that links the manipulated and responding variables | The bigger the balloon, the farther the distance. |
| Experimenting | Carrying out a fair test from aim to conclusion | Test balloon size, then write a report. |
Observation, inference and prediction
Classifying: the Mind Test animals
Pak Teh rears a cat, a cow, a goat, a hen, a duck and a swan. You must first choose a common characteristic and then sort the animals by it.
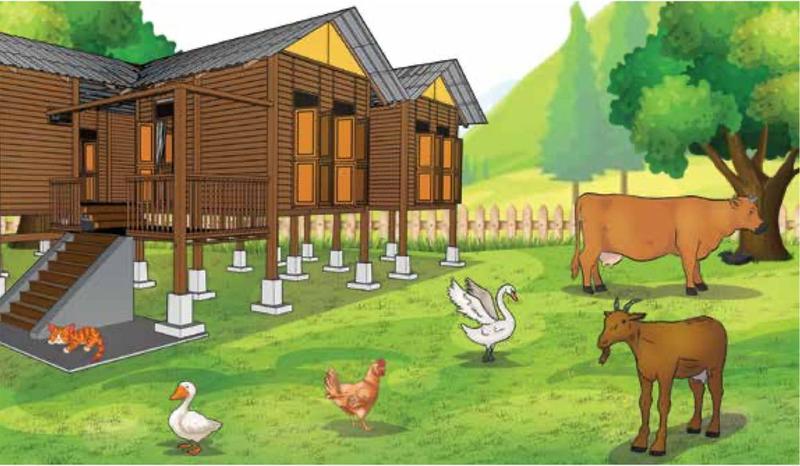
| Characteristic | Group 1 | Group 2 |
|---|---|---|
| Number of legs | Four legs: cat, cow, goat | Two legs: hen, duck, swan |
| Body covering | Fur or hair: cat, cow, goat | Feathers: hen, duck, swan |
Measuring and using numbers: reading a table and a chart
Raju records the distance each balloon car travelled and puts it in a table.
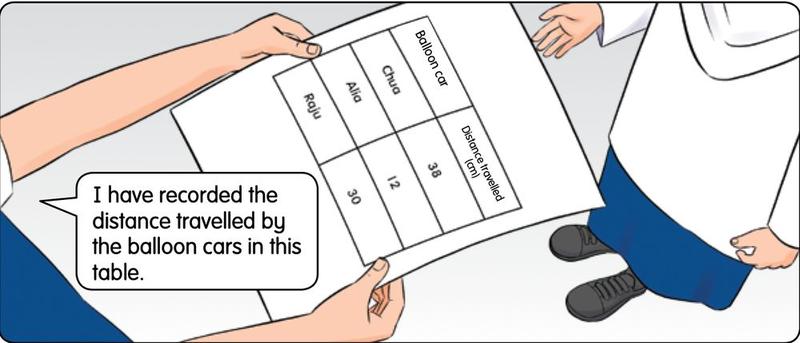
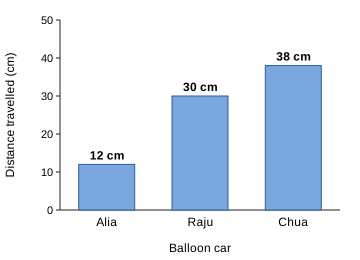
Chua's car went 38 − 12 = 26 cm farther than Alia's.
Pattern from the pupils' experiment: the bigger the balloon, the farther the car travels.
Show answerHide answer
1.2Planning a fair test
Variables
| Type | What it is | Balloon car (size of balloon) |
|---|---|---|
| Manipulated variable | The one you change on purpose | Size of the balloon |
| Responding variable | What you measure; it responds to the change | Distance travelled by the car |
| Constant (fixed) variable | What you keep the same so the test is fair | Type of plastic bottle, shape, size and mass of the car |
Hypothesis and operational definition
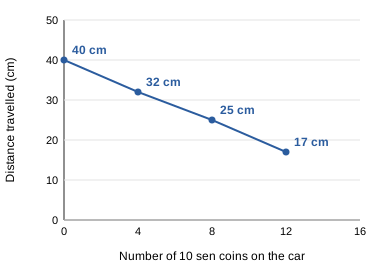
Hypothesis (mass): The lighter the balloon car, the farther the distance it travels.
Operational definition: The farthest balloon car is the one that travels the longest distance when measured with a ruler.
The experiment report
The textbook asks you to plan the "mass" experiment and write the report in this order.
- Aim: what you want to find out.
- Problem statement: a question, e.g. "Does the mass of the balloon car affect the distance travelled?"
- Hypothesis.
- Variables: manipulated, responding and constant.
- Apparatus and materials: here scissors, adhesive tape, ruler, a plastic bottle, bottle caps, straws, skewer sticks, a balloon and 12 pieces of 10 sen coin.
- Steps.
- Data: a table of results.
- Interpreting data: describe the pattern.
- Conclusion: say whether the hypothesis is accepted or not accepted, then state the conclusion.
Show answerHide answer
1.3Applying the skills
Magic Water (p. 9)
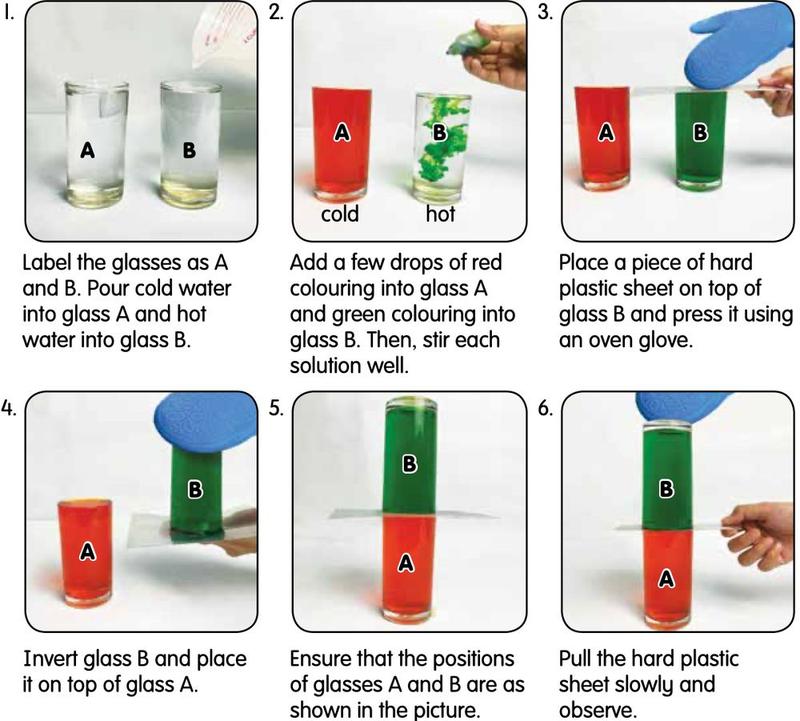
Hot water coloured green is placed upside down on top of cold water coloured red, with a plastic sheet between them. When the sheet is pulled out slowly, the two colours stay in two layers. This is because hot water is lighter (less dense) than cold water, so it stays on top. (The textbook only asks for your observation. This reason is not given in the book, but it is the correct scientific explanation.) Skills used include observing, measuring and using numbers, predicting, communicating, controlling variables (same glasses, same amount of water) and experimenting.
Mind Test: other ideas
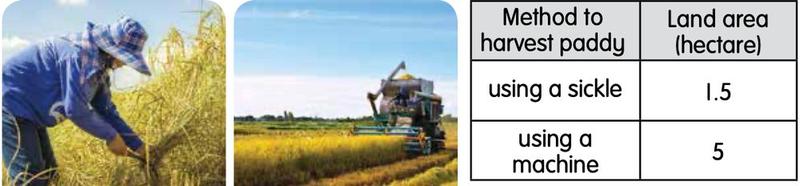
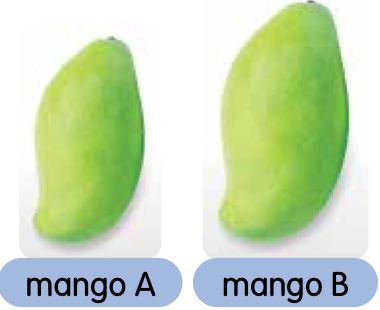
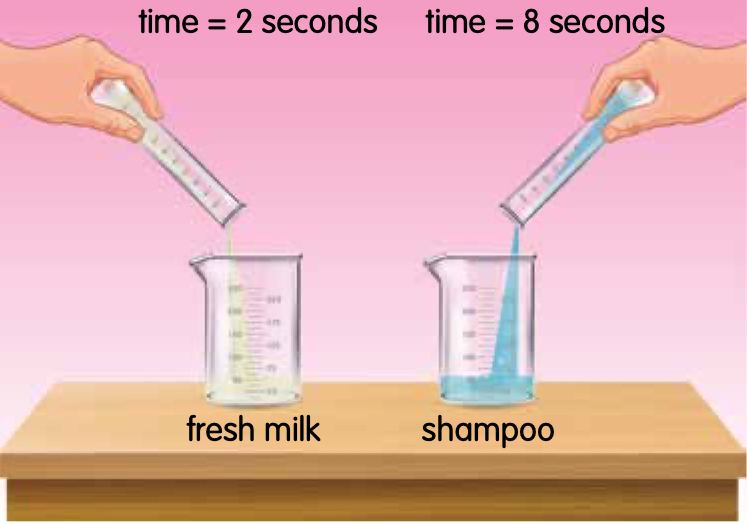
Summary
| Idea | Remember |
|---|---|
| Observation / inference / prediction | What you sense / why / what next |
| Manipulated variable | What you change |
| Responding variable | What you measure |
| Constant variable | What you keep the same |
| Hypothesis | "The more (less) A, the more (less) B" |
| Fastest car | Shortest time over the same distance |
| Report order | Aim, problem, hypothesis, variables, materials, steps, data, interpreting, conclusion |