Additional Mathematics notes, chapter 2
Quadratic Functions
Textbook Additional Mathematics Form 4 KSSM (DLP), pages 34–67
What this chapter covers
- Solve quadratic equations by completing the square and by the quadratic formula (2.1.1)
- Form a quadratic equation from given roots, using the sum and product of roots, and from related roots (2.1.2)
- Solve quadratic inequalities by graph sketching, the number line and the table method (2.1.3)
- Use the discriminant to determine the types of roots and to find unknown values (2.2.1, 2.2.2)
- Analyse the effect of changing a, b and c on the graph of f(x) = ax² + bx + c, and relate the position of the graph to the types of roots (2.3.1, 2.3.2)
- Relate the vertex, general and intercept forms of a quadratic function and analyse the effect of a, h and k (2.3.3, 2.3.4)
- Sketch graphs of quadratic functions and solve problems involving maximum and minimum values (2.3.5, 2.3.6)
2.1Quadratic equations and inequalities
A quadratic equation in general form is ax2 + bx + c = 0, where a, b and c are constants and a ≠ 0. Its solutions are called roots.
The roots of ax2 + bx + c = 0 are the x-coordinates of the points where the graph y = ax2 + bx + c cuts the x-axis. Besides factorisation, there are two more ways to find them.
Completing the square
Steps: (1) divide by a so that the x2 coefficient is 1; (2) move the constant to the right; (3) add (coefficient of x)22 to both sides; (4) write the left side as (x + p)2; (5) take the square root of both sides with ±.
Example 1(a) (textbook p. 37): solve x2 + 4x − 7 = 0
x2 + 4x = 7x2 + 4x + 22 = 7 + 22
(x + 2)2 = 11
x + 2 = ±√11, so x = −5.317 or x = 1.317
Solve x2 − 6x + 2 = 0 by completing the square. Give the answers to 3 decimal places.
Show answerHide answer
x2 − 6x = −2; x2 − 6x + 9 = −2 + 9; (x − 3)2 = 7; x = 3 ± √7.
x = 0.354 or x = 5.646
x = 0.354 or x = 5.646
Quadratic formula
For ax2 + bx + c = 0: x = −b ± √(b2 − 4ac)2a. Write down a, b and c first, with their signs.
Example 2 (textbook p. 38): solve 2x2 − 2x − 3 = 0
a = 2, b = −2, c = −3x = 2 ± √(4 + 24)4 = 2 ± √284
x = −0.823 or x = 1.823
When b is negative, −b is positive. Put a negative b in brackets, (−2)2, so that you do not lose the sign when squaring.
Forming a quadratic equation from its roots
If the roots are α and β, then sum of roots α + β = −ba and product of roots αβ = ca. The equation is x2 − (α + β)x + αβ = 0.
Example 4(b) (textbook p. 40): roots 2α and 2β, where α and β are the roots of 2x2 + x − 4 = 0
α + β = −12, αβ = −2.New sum = 2(α + β) = −1. New product = 4αβ = −8.
Equation: x2 + x − 8 = 0
For new roots, build the new sum and product from α + β and αβ only. Useful: α2 + β2 = (α + β)2 − 2αβ.
α and β are the roots of x2 − 5x + 3 = 0. Form the equation with roots α + 1 and β + 1.
Show answerHide answer
α + β = 5, αβ = 3. New sum = 5 + 2 = 7. New product = αβ + (α + β) + 1 = 3 + 5 + 1 = 9.
x2 − 7x + 9 = 0
x2 − 7x + 9 = 0
Quadratic inequalities
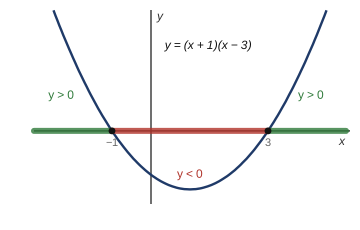
For (x − a)(x − b) with a < b, find where the expression is positive or negative. The three methods (graph sketch, number line, table) give the same answer.
| Inequality | Solution | Shape of the answer |
|---|---|---|
| (x − a)(x − b) > 0 | x < a or x > b | Two separate parts (outside the roots) |
| (x − a)(x − b) < 0 | a < x < b | One interval (between the roots) |
Example 5 (textbook p. 43): (2x − 1)(x + 4) > x + 4
2x2 + 7x − 4 > x + 4, so 2x2 + 6x − 8 > 0, so x2 + 3x − 4 > 0.(x + 4)(x − 1) > 0. Roots: −4 and 1. The graph opens up, so y > 0 outside the roots.
x < −4 or x > 1
Never cancel (x + 4) from both sides. You would lose the root x = −4. Move everything to one side, make it 0 on the other side, then factorise.
Solve 2x2 > x + 6.
Show answerHide answer
2x2 − x − 6 > 0, (2x + 3)(x − 2) > 0. Roots −32 and 2.
x < −32 or x > 2
x < −32 or x > 2
2.2Types of roots of quadratic equations
The discriminant is D = b2 − 4ac, the expression under the root sign in the quadratic formula. Its value tells the type of roots.
| Discriminant | Roots | Graph y = ax2 + bx + c |
|---|---|---|
| b2 − 4ac > 0 | Two different real roots | Cuts the x-axis at two points |
| b2 − 4ac = 0 | Two equal real roots | Touches the x-axis at one point (x-axis is a tangent) |
| b2 − 4ac < 0 | No real roots | Does not meet the x-axis |
Real roots means D ≥ 0 (two different or two equal). If D < 0 the roots are called imaginary roots (they are not real numbers, so the graph does not meet the x-axis).
Example 6(c) (textbook p. 46): 2x2 − 4x + 5 = 0
a = 2, b = −4, c = 5b2 − 4ac = (−4)2 − 4(2)(5) = 16 − 40 = −24 (< 0)
No real roots.
Using the discriminant to find unknown values
Arrange the equation in general form, write a, b, c (they may contain the unknown), then use D = 0, D > 0 or D < 0.
Example 7(a) (textbook p. 47): x2 + k + 3 = kx has two equal real roots
x2 − kx + (k + 3) = 0, so a = 1, b = −k, c = k + 3.D = 0: k2 − 4(k + 3) = 0, k2 − 4k − 12 = 0, (k + 2)(k − 6) = 0.
k = −2 or k = 6
The condition on the unknown can itself be a quadratic inequality. For D > 0 or D < 0, solve it with the number line or graph sketch, as in 2.1. Answers like −18 < m < 2 are ranges, not single values.
x2 + 6x + k = 0 has no real roots. Find the range of k.
Show answerHide answer
D < 0: 36 − 4k < 0, so 4k > 36. k > 9
2.3Quadratic functions
A quadratic function is f(x) = ax2 + bx + c with a ≠ 0. Its graph is a parabola, symmetrical about the axis of symmetry, with a minimum point (a > 0, ∪ shape) or a maximum point (a < 0, ∩ shape).
Effect of a, b and c on f(x) = ax2 + bx + c
| Value changed | What happens to the graph |
|---|---|
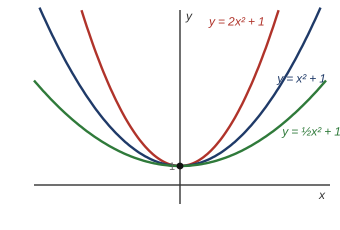
| a | Changes the shape and width. a > 0: minimum point; a < 0: maximum point. The larger |a|, the narrower the graph. The y-intercept stays at c. |
| b | Changes the position of the vertex relative to the y-axis (b = 0: vertex on the y-axis; for a > 0, b > 0 puts it to the left). The shape and the y-intercept stay the same. |
| c | Moves the whole graph up (c increases) or down (c decreases). The shape is unchanged. c is the y-intercept. |
Position of the graph and the types of roots
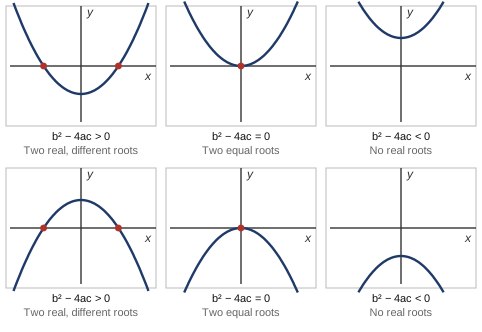
If D < 0 and a > 0, then f(x) > 0 for all x (always positive). If D < 0 and a < 0, then f(x) < 0 for all x (always negative).
Example 11(b) (textbook p. 53): f(x) = 2x2 + 5x + 3 − k has no x-intercept
No x-intercept means no real roots: D < 0.25 − 4(2)(3 − k) < 0, so 25 − 24 + 8k < 0, so 8k < −1.
k < −18
The graph of f(x) = x2 − 4x + m touches the x-axis. Find m.
Show answerHide answer
Touches at one point: D = 0. 16 − 4m = 0, m = 4 (f(x) = (x − 2)2).
Vertex form, general form and intercept form
| Form | Written as | What you can read off |
|---|---|---|
| Vertex | f(x) = a(x − h)2 + k | Vertex (h, k); axis x = h; k is the minimum (a > 0) or maximum (a < 0) value |
| General | f(x) = ax2 + bx + c | y-intercept c; axis x = −b2a |
| Intercept | f(x) = a(x − p)(x − q) | x-intercepts p and q; axis x = p + q2 |
Vertex to general: expand. General to vertex: complete the square (factorise a out first). General to intercept: factorise or use the formula. Only graphs that cut the x-axis have an intercept form.
Example 13 (textbook p. 56): express f(x) = −3x2 + 2x + 1 as a(x − h)2 + k
f(x) = −3(x2 − 23x) + 1 = −3[(x − 13)2 − 19] + 1= −3(x − 13)2 + 13 + 1 = −3(x − 13)2 + 43
Factorising −3 out of the x-terms also multiplies the square you subtract: −3 × (−19) = +13. Many students forget to multiply that constant by a.
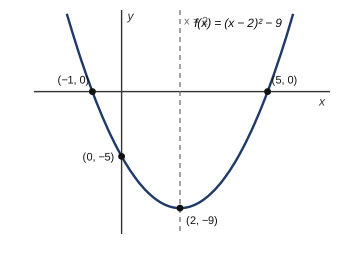
Effect of a, h and k on f(x) = a(x − h)2 + k
| Value changed | Effect |
|---|---|
| a | Changes the width (larger |a| gives a narrower graph) and its direction. Axis and vertex stay the same. |
| h | Moves the graph horizontally: h increases, graph moves right. The axis x = h moves; the minimum or maximum value is unchanged. |
| k | Moves the graph vertically: k increases, graph moves up. The axis is unchanged; the minimum or maximum value is k. |
In f(x) = 2(x + 2)2 + 3 the value of h is −2, not +2. Moving to 2(x + 6)2 + 3 sends the graph 4 units to the left.
Compare the graph of f(x) = 3(x − 1)2 + 5 with the graph of f(x) = x2.
Show answerHide answer
Narrower (a = 3 > 1), moved 1 unit to the right (h = 1) and 5 units up (k = 5). Vertex (1, 5), minimum value 5, axis x = 1.
Sketching the graph of a quadratic function
- Use a to decide the shape (∪ or ∩).
- Find D to see how many x-intercepts there are.
- Find the vertex (complete the square, or x = −b2a).
- Solve f(x) = 0 for the x-intercepts.
- Find f(0) for the y-intercept.
- Plot the points and draw a smooth curve symmetrical about the axis.
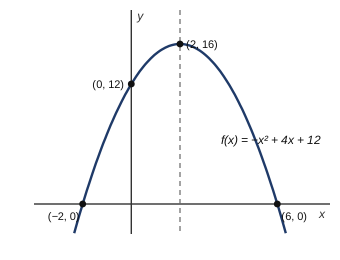
Example 15 (textbook p. 60): sketch f(x) = −x2 + 4x + 12
a < 0: maximum point. D = 16 + 48 = 64 > 0: two x-intercepts.f(x) = −(x − 2)2 + 16: maximum point (2, 16), axis x = 2.
f(x) = 0: (6 − x)(x + 2) = 0, x = −2 or x = 6. f(0) = 12.
Solving problems
Follow four steps: understand the problem, plan (vertex form for the maximum or minimum; solve f = 0 for the intercepts), carry out the plan, then conclude with units. Reject answers that do not make sense (a negative time or length).
Example 16 (textbook p. 61): javelin height h(t) = −5t2 + 14t + 3
Maximum: t = −142(−5) = 1.4 s, h(1.4) = −9.8 + 19.6 + 3 = 12.8 m.On the ground: −5t2 + 14t + 3 = 0, (5t + 1)(t − 3) = 0, t = −15 (rejected) or t = 3 s.
A ball is thrown so that its height is h(t) = −5t2 + 10t + 1.25 m after t seconds. Find the maximum height.
Show answerHide answer
t = −102(−5) = 1 s. h(1) = −5 + 10 + 1.25 = 6.25 m.
Content and examples follow Additional Mathematics Form 4 KSSM (DLP) textbook, Chapter 2, pp. 34–67.