Physics notes, chapter 1
Measurement
Textbook Physics Form 4 KSSM (DLP), pages 2–22
What this chapter covers
- Identify physical quantities and state their magnitude and S.I. unit (1.1.1)
- List the seven base quantities with their S.I. units and symbols (1.1.2)
- Express derived quantities and units in terms of base quantities and base units (1.1.3)
- Distinguish scalar quantities from vector quantities (1.1.4)
- Interpret the shapes of graphs and the relationship between two quantities (1.2.1)
- Analyse a graph using gradient, area under the graph, interpolation and extrapolation (1.2.2)
- Plan and report a scientific investigation, using a simple pendulum as the example (1.2.3)
1.1Physical quantities
Measurement is a method to determine the value of a physical quantity. A physical quantity is always stated as magnitude + unit, for example length = 100 m.
Metric units (centimetre, kilopascal) are used in science. Imperial units (inch, mile, psi) are seldom used. Mixing the two caused the Mars Climate Orbiter to be lost in 1999. Scientists everywhere use the International System of Units, the S.I., agreed in 1960.
Base quantities
A base quantity cannot be derived from another physical quantity. There are seven.
| Base quantity | Symbol | S.I. unit | Unit symbol |
|---|---|---|---|
| Length | l | metre | m |
| Mass | m | kilogram | kg |
| Time | t | second | s |
| Thermodynamic temperature | T | kelvin | K |
| Electric current | I | ampere | A |
| Luminous intensity | Iv | candela | cd |
| Amount of substance | n | mole | mol |
Remember the S.I. unit of mass is the kilogram, not the gram, so always convert before using a formula.
Derived quantities
A derived quantity is built from base quantities through a formula. Its unit is built from the base units in the same way.
| Derived quantity | Formula | In base quantities | S.I. unit |
|---|---|---|---|
| Area | A = l2 | l × l | m2 |
| Volume | V = l3 | l × l × l | m3 |
| Density | ρ = m / V | m / l3 | kg m−3 |
| Velocity | v = l / t | l / t | m s−1 |
| Acceleration | a = v / t | l / t2 | m s−2 |
| Force | F = m × a | ml / t2 | kg m s−2 = newton (N) |
| Momentum | p = m × v | ml / t | kg m s−1 |
| Pressure | P = F / A | m / (l t2) | kg m−1 s−2 = pascal (Pa) |
| Work or energy | W = F × l | ml2 / t2 | kg m2 s−2 = joule (J) |
| Charge | Q = I × t | I × t | A s = coulomb (C) |
Worked example: unit of power
Power = work ÷ time, and work = force × length.Unit of work = kg m s−2 × m = kg m2 s−2.
Unit of power = kg m2 s−2 ÷ s = kg m2 s−3 (the watt, W).
Writing the newton as a base unit. N, Pa, J and C are named derived units; they are never base units.
Derive the unit of pressure in base units.
Show answerHide answer
P = F / A = (kg m s−2) / m2 = kg m−1 s−2.
Scalar and vector quantities
A scalar has magnitude only. A vector has magnitude and direction.
| Scalar | Vector |
|---|---|
| Distance, length, area, volume, time, speed, work, energy, temperature, density | Displacement, velocity, acceleration, force, momentum |
Example
"Run 50 m" gives a distance (scalar). "Run 50 m towards that tree" gives a displacement (vector), because a direction is stated.Speed is the scalar partner of velocity. If a question gives a direction (north, upward, towards), the quantity is a vector.
1.2Scientific investigation
Shapes of graphs
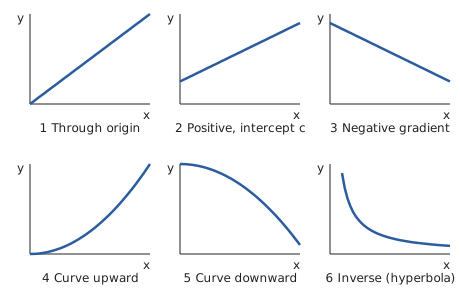
| Graph | Meaning | Equation |
|---|---|---|
| 1 Straight line through origin | y is directly proportional to x | y = mx |
| 2 Straight line, positive gradient, intercept c | y increases linearly with x | y = mx + c |
| 3 Straight line, negative gradient | y decreases linearly with x | y = mx + c (m < 0) |
| 4 Curve rising from origin | y increases with x | no simple equation |
| 5 Curve falling | y decreases with x | no simple equation |
| 6 Curve that never touches either axis | y is inversely proportional to x; the graph of y against 1/x is a straight line through the origin | y = k / x |
Saying "y increases with x" is not the same as "directly proportional". Directly proportional means a straight line that passes through the origin.
Five things to analyse in a graph
- Relationship between the variables: read the shape.
- Gradient: m = Δy / Δx = (y2 − y1) / (x2 − x1). Use a large triangle and points on the line, not table values.
- Area under the graph: rectangle = base × height, triangle = ½ × base × height.
- Interpolation: reading a value between plotted points.
- Extrapolation: extending the line beyond the data to predict a value.
The gradient and area carry units. The unit of the gradient is (unit of y) ÷ (unit of x); the unit of the area is (unit of y) × (unit of x).
Worked example: spring (textbook Activity 1.3)
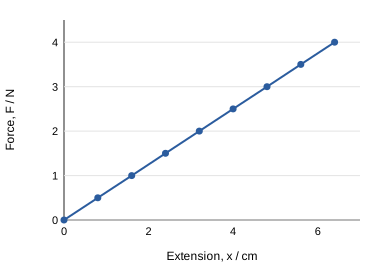
(b) Gradient k = (4.0 − 0.5) / (6.4 − 0.8) = 3.5 / 5.6 = 0.625 N cm−1 = 62.5 N m−1.
(c) Work done = area under the graph = ½ F x. At x = 5 cm, F = 0.625 × 5 = 3.125 N, so W = ½ × 3.125 × 0.05 = 0.078 J (convert 5 cm to 0.05 m).
(d) Interpolation: at x = 3.5 cm, F = 0.625 × 3.5 = 2.2 N (read between plotted points).
(e) Extrapolation: F = 5.0 N gives x = 5.0 / 0.625 = 8.0 cm.
Data and set-up: Physics Form 4 (DLP) textbook, Activity 1.3, p. 13.
A straight line passes through (0, 10) and (15, 40). State its gradient and equation.
Show answerHide answer
Gradient = (40 − 10) / (15 − 0) = 2.0. Intercept = 10, so y = 2x + 10.
Plotting a graph
- Put the manipulated variable on the x-axis and the responding variable on the y-axis.
- Label each axis with the quantity and its unit, for example l / cm.
- Choose even scales so the points fill at least half of the graph paper.
- Mark each point clearly and draw one smooth best-fit line or curve, with points on both sides of it.
Simple pendulum investigation (Experiment 1.1)
| Part | In this experiment |
|---|---|
| Inference | The period of a pendulum depends on its length |
| Hypothesis | The longer the pendulum, the longer its period |
| Aim | To investigate the relationship between length l and period T |
| Manipulated variable | Length of pendulum, l |
| Responding variable | Period of oscillation, T |
| Constant variable | Mass of the bob |
- Apparatus: retort stand, thread, pendulum bob, stopwatch, metre rule, protractor and G-clamp.
- Change l (20.0 cm to 70.0 cm). For each length, displace the bob through less than 10° and time 20 complete oscillations, twice. Then taverage = (t1 + t2) / 2 and T = taverage / 20.
- Timing 20 oscillations reduces the error caused by the reaction time of the person using the stopwatch; repeating the timing and averaging reduces random error.
- Plot T2 against l: a straight line through the origin. Since T2 = 4π2l / g, the gradient m = 4π2 / g, so g = 4π2 / m.
Worked example
20 oscillations take 28.0 s. Period T = 28.0 / 20 = 1.40 s. With g = 10 m s−2, l = gT2 / 4π2 = 10 × 1.96 / 39.5 = 0.50 m.Taking T as the time for one oscillation measured once. A single oscillation is too short to time accurately; always use 20 and divide.
The same pendulum is taken to the Moon. Will its gradient of T2 against l change?
Show answerHide answer
Yes. The gradient is 4π2 / g and g on the Moon is smaller, so the gradient is larger.