Physics questions, chapter 1
Nama / NameKelas / ClassTarikh / Date
Measurement
44 marks. Use Practice to check each answer as you go, or Exam to answer everything against the clock first.
Section A: objective questions
12 marksChoose the best answer for each question.
1
Question 1
Which of the following is a base quantity?
Show answerHide answer
B
Mass is one of the seven base quantities. Velocity, density and force are derived quantities.
2
Question 2
What is the S.I. unit of electric current?
Show answerHide answer
A
The base unit of electric current is the ampere (A). The coulomb is the unit of charge; the mole is the unit of amount of substance.
3
Question 3
Which of these is a vector quantity?
Show answerHide answer
C
Displacement has magnitude and direction. The other three have magnitude only.
4
Question 4
Force is given by F = ma. What is the unit of force in S.I. base units?
Show answerHide answer
D
a has unit m s⁻², so F = kg × m s⁻² = kg m s⁻² (a newton).
5
Question 5
Acceleration a = v / t. What is its unit in S.I. base units?
Show answerHide answer
B
v is in m s⁻¹, so a = (m s⁻¹) / s = m s⁻².
6
Question 6
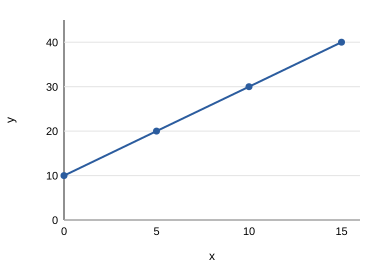
Diagram 1 shows a graph of y against x. What is the gradient of the graph?
Show answerHide answer
D
Gradient = (40 − 10) / (15 − 0) = 30 / 15 = 2.0.
7
Question 7
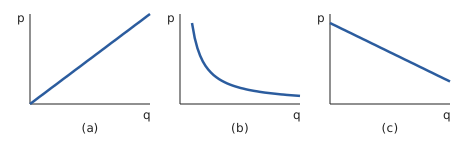
Diagram 2 shows three graphs of p against q. Which graph shows that p is inversely proportional to q?
Show answerHide answer
B
An inverse relationship gives a curve that does not touch either axis (graph b). Graph (a) is direct proportion; graph (c) is a linear decrease that cuts the axes.
8
Question 8
A graph of y against x is a straight line that passes through the origin. What does this show?
Show answerHide answer
A
A straight line through the origin has the equation y = mx, so y is directly proportional to x.
9
Question 9
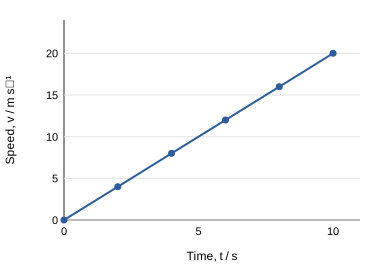
Diagram 3 shows a speed-time graph of a car. What is the distance travelled in 10 s?
Show answerHide answer
C
Distance = area under the graph = ½ × 10 s × 20 m s⁻¹ = 100 m.
10
Question 10
Reading a value from a graph beyond the range of the plotted data is called
Show answerHide answer
C
Extending the line beyond the data to predict a value is extrapolation. Reading between plotted points is interpolation.
11
Question 11
A pendulum takes 36.0 s to make 20 complete oscillations. What is its period?
Show answerHide answer
A
T = 36.0 / 20 = 1.80 s.
12
Question 12
Power P = (force × length) / time. What is the unit of P in S.I. base units?
Show answerHide answer
D
Force = kg m s⁻², times m gives kg m² s⁻², divided by s gives kg m² s⁻³ (the watt).
Section B: structured questions
32 marksAnswer all questions. Show your working.
13
Question 13
Physical quantities are either base quantities or derived quantities.
[3 marks]
(a)State the S.I. unit and its symbol for each base quantity: (i) time, (ii) thermodynamic temperature, (iii) luminous intensity.
Show answerHide answer
Tick each point you got.
[2 marks]
(b)Pressure P = F / A. Derive the unit of pressure in S.I. base units.
Show answerHide answer
Tick each point you got.
14
Question 14
A pupil's height is measured with a tape measure and the reading is 1.65 m.
[1 mark]
(a)State the physical quantity that is measured.
Show answerHide answer
Tick each point you got.
[2 marks]
(b)State the S.I. unit of this quantity and its symbol.
Show answerHide answer
Tick each point you got.
[1 mark]
(c)State the magnitude of the measurement.
Show answerHide answer
Tick each point you got.
15
Question 15
A driver wants to travel 240 km to Kuantan at a speed of 80 km h⁻¹. To arrive on time she increases her speed with an acceleration of 0.5 m s⁻².
[1 mark]
(a)State the difference between a scalar quantity and a vector quantity.
Show answerHide answer
Tick each point you got.
[2 marks]
(b)Name two scalar quantities in the passage.
Show answerHide answer
Tick each point you got.
[1 mark]
(c)Which quantity in the passage is a vector?
Show answerHide answer
Acceleration
16
Question 16
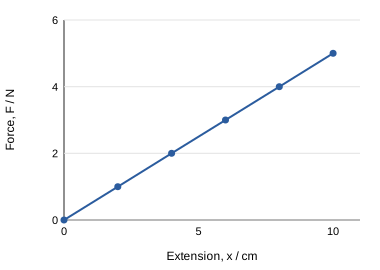
Diagram 4 shows a graph of the force F applied to another spring against its extension x.
[1 mark]
(a)State the relationship between F and x.
Show answerHide answer
Tick each point you got.
[2 marks]
(b)Calculate the gradient of the graph in N m⁻¹.
Show answerHide answer
Tick each point you got.
[2 marks]
(c)Calculate the work done to stretch the spring by 8.0 cm. (Work = area under the graph.)
Show answerHide answer
Tick each point you got.
[1 mark]
(d)Predict the extension when F = 7.0 N.
Show answerHide answer
Tick each point you got.
17
Question 17
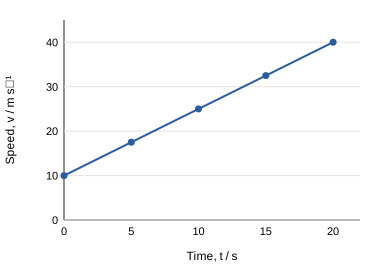
Diagram 5 shows the speed v of a car against time t. The car already has a speed when timing starts.
[1 mark]
(a)State the y-intercept and what it represents.
Show answerHide answer
Tick each point you got.
[2 marks]
(b)Calculate the gradient and state what it represents.
Show answerHide answer
Tick each point you got.
[2 marks]
(c)Calculate the distance travelled in the first 20 s, using the area under the graph.
Show answerHide answer
Tick each point you got.
18
Question 18
A pupil investigates a simple pendulum. For a pendulum of fixed length, 20 complete oscillations take 32.0 s. Use g = 10 m s⁻² and π = 3.14.
[1 mark]
(a)Calculate the period T.
Show answerHide answer
Tick each point you got.
[1 mark]
(b)Why is the time for 20 oscillations measured, rather than one?
Show answerHide answer
Tick each point you got.
[2 marks]
(c)The length l is given by l = (g / 4π²) T². Calculate l.
Show answerHide answer
Tick each point you got.
[1 mark]
(d)State one precaution to increase the accuracy of the results.
Show answerHide answer
Any 1 points
Tick each point you got.
19
Question 19
A pupil suspects that the period of a simple pendulum depends on the mass of the bob. Plan an investigation.
[2 marks]
(a)State the manipulated variable and the responding variable.
Show answerHide answer
Tick each point you got.
[1 mark]
(b)State one variable that must be kept constant.
Show answerHide answer
Any 1 points
Tick each point you got.