Additional Mathematics questions, chapter 7
Nama / NameKelas / ClassTarikh / Date
Linear Programming
44 marks. Use Practice to check each answer as you go, or Exam to answer everything first. Show your working for Section B.
Section A: objective questions
11 marksChoose the correct answer. Each question carries 1 mark.
1
Question 1
In a linear programming problem, what is the objective function?
Show answerHide answer
B
The objective function is the quantity to optimise, such as profit or cost, written as k = ax + by. The inequalities are the constraints; the region is the feasible region.
2
Question 2
Which inequality is graphed with a dashed line?
Show answerHide answer
C
A strict symbol (< or >) gives a dashed line because points on the line are not included. ≤ and ≥ give a solid line.
3
Question 3
Which describes the graph of 3x − 2y ≥ 6?
Show answerHide answer
D
3x − 2y ≥ 6 gives −2y ≥ 6 − 3x, so y ≤ 1.5x − 3 (dividing by −2 reverses the symbol). That is below the line, and ≥ in the original means a solid line. Test (0, 0): 0 ≥ 6 is false, and (0, 0) is above the line.
4
Question 4
A company uses x lorries and y vans. The number of vans is at least three times the number of lorries. Which inequality represents this?
Show answerHide answer
A
'At least' means ≥, and three times the lorries is 3x, so y ≥ 3x. The second option swaps the variables.
5
Question 5
A factory makes x cars of type M and y cars of type N. The total made is at most 80 and at least 10 are type N. Which pair of inequalities represents this?
Show answerHide answer
C
'At most 80' is x + y ≤ 80 and 'at least 10' is y ≥ 10. The last option uses strict symbols, which would exclude exactly 80 and exactly 10.
6
Question 6
A table P costs RM200 and a table Q costs RM100. The money spent on x tables P and y tables Q must not exceed RM6 000. Which inequality, in its simplest form, represents this?
Show answerHide answer
B
200x + 100y ≤ 6 000. Divide by 100: 2x + y ≤ 60. 'Must not exceed' is ≤.
7
Question 7
Which point lies in the region defined by x + 2y ≥ 30, 2x + y ≤ 60 and y ≤ 2x?
Show answerHide answer
A
(12, 20): 12 + 40 = 52 ≥ 30, 24 + 20 = 44 ≤ 60 and 20 ≤ 24. (5, 10) gives x + 2y = 25. (20, 30) gives 2x + y = 70. (10, 25) has y > 2x.
8
Question 8
The vertices of a feasible region are (2, 1), (2, 6) and (8, 4). Find the maximum value of 3x + 2y.
Show answerHide answer
D
3x + 2y at (2, 1) is 8, at (2, 6) is 18 and at (8, 4) is 24 + 8 = 32. The maximum is 32.
9
Question 9
The vertices of the feasible region R are (1, 4), (1, 9), (6, 9) and (6, 2). Find the minimum value of the cost 2x + 3y.
Show answerHide answer
A
2x + 3y at the vertices is 14, 29, 39 and 18. The least is 14, at (1, 4).
10
Question 10
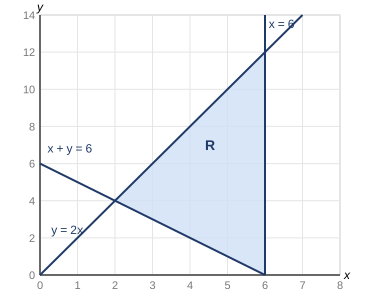
Diagram 1 shows the shaded region R. Which set of inequalities defines R?
Show answerHide answer
C
R is below y = 2x, above x + y = 6 and to the left of x = 6. Test (5, 5): 5 ≤ 10, 10 ≥ 6, 5 ≤ 6, all true.
11
Question 11
In a feasible region, the maximum or minimum value of the objective function occurs at
Show answerHide answer
B
Moving the objective line parallel to itself, the last (or first) point it touches is a vertex of the feasible region.
Section B: structured questions
33 marksAnswer all questions. Show your working.
12
Question 12
Diagram 2 shows two shaded regions. In (a) the line passes through (0, 4) and (6, 0). In (b) the line passes through (0, −2) and (4, 0).
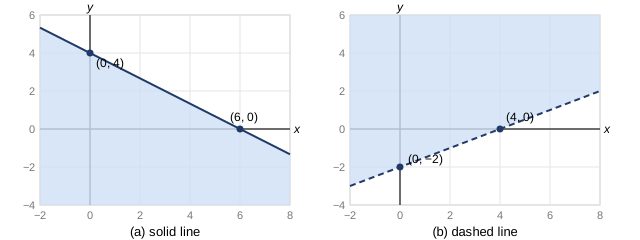
[2 marks]
(a)Write the inequality for the shaded region in (a).
Show answerHide answer
Tick each point you got.
[2 marks]
(b)Write the inequality for the shaded region in (b).
Show answerHide answer
Tick each point you got.
13
Question 13
Xin Tian plants x hectares of banana trees and y hectares of papaya trees on at most 80 hectares of land. Each hectare of banana trees needs 3 workers and each hectare of papaya trees needs 6 workers; he can hire at most 360 workers. Maintenance costs RM800 per hectare for banana and RM300 per hectare for papaya, and his capital is at least RM24 000. Other than x ≥ 0 and y ≥ 0, write three inequalities.
[1 mark]
(a)The land used.
Show answerHide answer
Tick each point you got.
[2 marks]
(b)The number of workers, in its simplest form.
Show answerHide answer
Tick each point you got.
[2 marks]
(c)The capital.
Show answerHide answer
Tick each point you got.
14
Question 14
Diagram 3 shows the feasible region of a situation. The objective function is k = 2x + y.
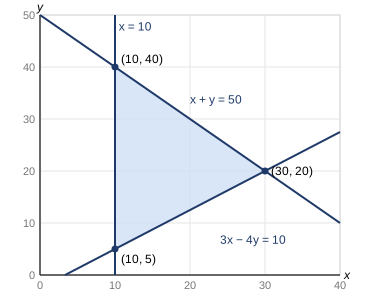
[2 marks]
(a)Find the value of k at each vertex.
Show answerHide answer
Tick each point you got.
[1 mark]
(b)State the maximum value of k.
Show answerHide answer
Tick each point you got.
[1 mark]
(c)State the minimum value of k.
Show answerHide answer
Tick each point you got.
15
Question 15
A canteen prepares x packets of nasi lemak and y packets of mee goreng. The conditions are: I at most 60 packets in all; II the packets of mee goreng are at most twice the packets of nasi lemak; III at least 10 packets of mee goreng. Diagram 4 shows the region R that satisfies all the conditions.
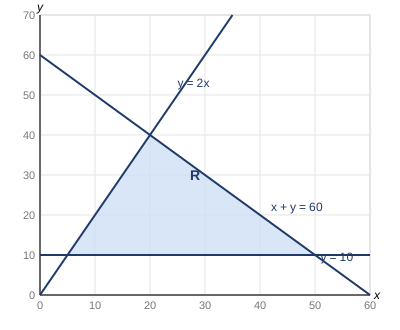
[3 marks]
(a)Write the three inequalities for conditions I, II and III.
Show answerHide answer
Tick each point you got.
[2 marks]
(b)Use Diagram 4 to find the least and greatest number of packets of nasi lemak when 20 packets of mee goreng are made.
Show answerHide answer
Tick each point you got.
[3 marks]
(c)The profit is RM2 per packet of nasi lemak and RM3 per packet of mee goreng. Find the maximum profit.
Show answerHide answer
(20, 40) is where y = 2x meets x + y = 60: 3x = 60.
Tick each point you got.
16
Question 16
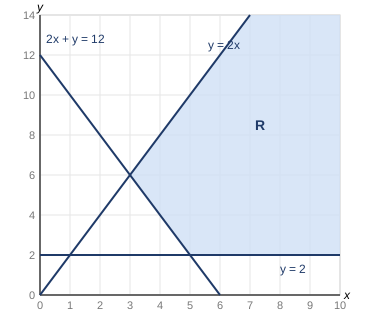
A post office hires x lorries and y vans to carry at least 600 parcels. A lorry carries 100 parcels and a van carries 50 parcels. The number of vans is at most twice the number of lorries, and at least 2 vans are used. Diagram 5 shows region R, which continues beyond the grid. A lorry costs RM150 and a van costs RM100.
[3 marks]
(a)Write three inequalities, other than x ≥ 0 and y ≥ 0, in simplest form.
Show answerHide answer
Tick each point you got.
[1 mark]
(b)Find the least number of lorries needed if only 2 vans are used.
Show answerHide answer
Tick each point you got.
[3 marks]
(c)Find the minimum cost.
Show answerHide answer
In a region that is unbounded, check the vertices for a minimum: cost only grows when moving away.
Tick each point you got.
17
Question 17
Aina says: 'The region for 2x − 3y > 6 is above the line 2x − 3y = 6 because the symbol is >.'
[1 mark]
(a)Is Aina correct?
Show answerHide answer
No
The coefficient of y is negative, so the sides swap.
[2 marks]
(b)Write the inequality as y < ... or y > ... and state which side of the line is the region.
Show answerHide answer
Tick each point you got.
[2 marks]
(c)Use the point (0, 0) to check your answer, and state the type of line.
Show answerHide answer
Tick each point you got.