Graphs of Functions
What this chapter covers
- Explain the meaning of a function as a relation in which each object has only one image (8.1.1)
- Identify one-to-one, many-to-one, one-to-many and many-to-many relations, and decide which are functions (8.1.1)
- Identify functions and justify the answer from ordered pairs, tables, graphs and equations (8.1.2)
- State the domain, codomain, object, image and range of a function, and write it with f(x) notation (8.1.2)
- Construct tables of values for linear and non-linear functions (8.2.1)
- Draw graphs of linear, quadratic, cubic and reciprocal functions using a given scale (8.2.1)
- Interpret graphs of functions to find values of x and y, and to make inferences and predictions (8.2.2)
- Solve problems involving graphs of functions (8.2.3)
A taxi fare, the height of a kicked ball and the cost of a phone plan all depend on another quantity. Whenever one quantity is fixed by another, we can write the link as a function and draw it as a graph. In this chapter you will decide whether a relation is a function, build a table of values, draw straight line and curved graphs, and read information from them.
| English | Bahasa Melayu |
|---|---|
| function | fungsi |
| relation | hubungan |
| variable | pemboleh ubah |
| graph of function | graf fungsi |
| table of values | jadual nilai |
| linear function, non-linear function | fungsi linear, fungsi bukan linear |
| quadratic function, cubic function | fungsi kuadratik, fungsi kubik |
| reciprocal function | fungsi salingan |
| scale | skala |
8.1Functions
Relations and their types
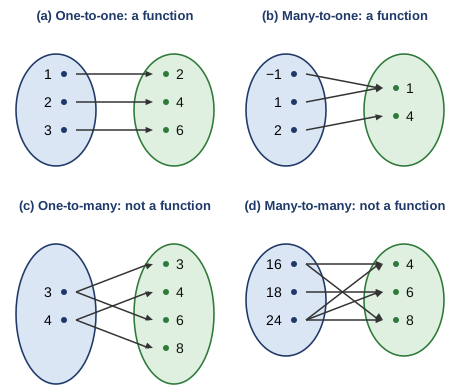
There are four types of relation, depending on how many images each object has and how many objects share an image (textbook pp. 147-149, Examples 1 and 2).
| Type | Meaning | Example (ordered pairs) | Function? |
|---|---|---|---|
| One-to-one | Each object has one image, and each image has one object | {(1, 2), (2, 4), (3, 6)} | Yes |
| Many-to-one | Each object has one image, but some objects share an image | {(−1, 1), (1, 1), (2, 4)} | Yes |
| One-to-many | At least one object has more than one image | {(3, 3), (3, 6), (4, 4), (4, 8)} | No |
| Many-to-many | At least one object has more than one image, and some objects share an image | {(16, 4), (16, 8), (18, 6), (24, 4), (24, 6), (24, 8)} | No |
Show answerHide answer
b) One-to-many (the object 2 has two images, 4 and 6). Not a function.
c) Many-to-one (−3 and 3 share the image 9). A function.
Domain, codomain and range
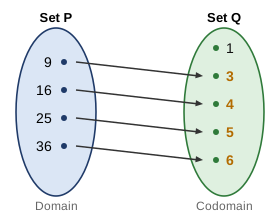
- The set of all objects is the domain: P = {9, 16, 25, 36}.
- The set of all the elements in set Q that objects may be matched to is the codomain: Q = {1, 3, 4, 5, 6}.
- The elements of the codomain that are actually matched are the images. The set of images is the range: {3, 4, 5, 6}.
Function notation: "f maps x to x − 1" is written f : x → x − 1 or f(x) = x − 1. Read f(3) as "the value of the function when x = 3": f(3) = 3 − 1 = 2 (textbook p. 149).
Representing a function
Example 1: set P = {1, 2, 3} is mapped to set Q = {4, 5, 6} by adding 3 (textbook p. 150)
| Representation | Form |
|---|---|
| Ordered pairs | {(1, 4), (2, 5), (3, 6)} |
| Table | x: 1, 2, 3 and y: 4, 5, 6 |
| Graph | Three points (1, 4), (2, 5), (3, 6) plotted on a Cartesian plane |
| Equation | y = x + 3, or f(x) = x + 3 |
Show answerHide answer
Ordered pairs: {(0, 5), (1, 3), (2, 1), (3, −1)}. Range = {5, 3, 1, −1}.
8.2Graphs of functions
Constructing a table of values
Substitute each given value of x into the function to find y. Put brackets around negative numbers and work out the power before multiplying (textbook pp. 151-152, Example 4).
Example 2: table of values for y = 2x² − 1
x = −1: y = 2(−1)² − 1 = 2(1) − 1 = 1
x = 0: y = 2(0)² − 1 = −1
x = 1: y = 2(1)² − 1 = 1
x = 2: y = 2(2)² − 1 = 2(4) − 1 = 7
| x | −1 | 0 | 1 | 2 |
|---|---|---|---|---|
| y | 1 | −1 | 1 | 7 |
Steps to draw a graph
- Construct a table of values for the given range of x.
- Draw and label the axes with the scale given (for example 2 cm to 1 unit on the x-axis and 2 cm to 2 units on the y-axis).
- Plot the points (x, y) from the table.
- Join the points with a ruler for a straight line or a smooth curve freehand for a curve. Label the graph with its equation.
The four shapes you must know
| Function | Power of x | General form | Shape of graph |
|---|---|---|---|
| Linear | 1 (highest) | y = mx + c | Straight line |
| Quadratic | 2 (highest) | y = ax² + bx + c, a ≠ 0 | Parabola (a smooth U or upside-down U) |
| Cubic | 3 (highest) | y = ax³ + c | Smooth S-shaped curve |
| Reciprocal | −1 | y = ax (that is, y = ax⁻¹) | Hyperbola: two separate branches |
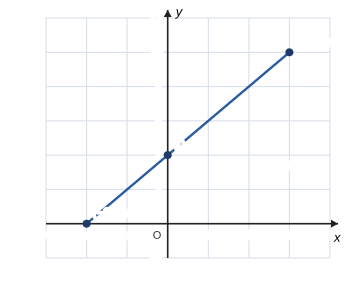
Example 3: linear function y = 2x + 4 for −2 ≤ x ≤ 3 (textbook p. 153)
| x | −2 | −1 | 0 | 1 | 2 | 3 |
|---|---|---|---|---|---|---|
| y | 0 | 2 | 4 | 6 | 8 | 10 |
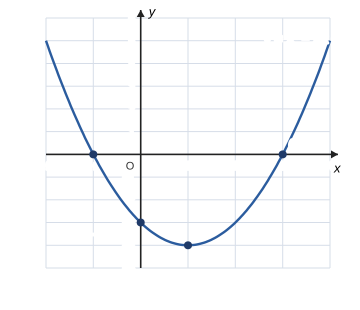
Example 4: quadratic function y = x² − 2x − 3 for −2 ≤ x ≤ 4 (textbook p. 154)
| x | −2 | −1 | 0 | 1 | 2 | 3 | 4 |
|---|---|---|---|---|---|---|---|
| y | 5 | 0 | −3 | −4 | −3 | 0 | 5 |
Example 5: cubic function y = 12 − x³ for −3 ≤ x ≤ 3 (textbook p. 155)
| x | −3 | −2 | −1 | 0 | 1 | 2 | 3 |
|---|---|---|---|---|---|---|---|
| y | 39 | 20 | 13 | 12 | 11 | 4 | −15 |
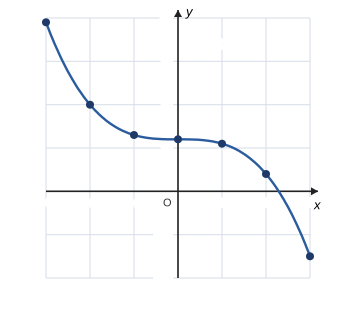
Example 6: reciprocal function y = 24x for −4 ≤ x ≤ 4 (textbook p. 156)
| x | −4 | −3 | −2 | −1 | 1 | 2 | 3 | 4 |
|---|---|---|---|---|---|---|---|---|
| y | −6 | −8 | −12 | −24 | 24 | 12 | 8 | 6 |
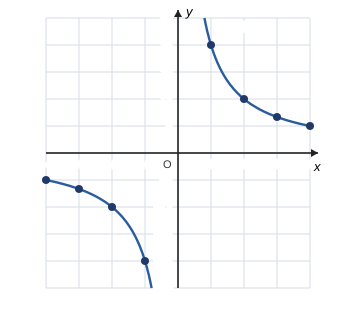
Show answerHide answer
b) A parabola (quadratic function, highest power 2)
c) y = −2, −3, −6, 6, 3, 2 (hyperbola)
Interpreting graphs of functions
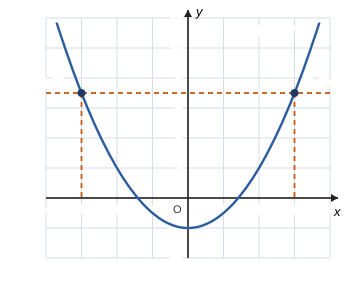
To read a value from a graph, draw a guide line to the curve and then to the other axis (textbook p. 158, Examples 10 and 11).
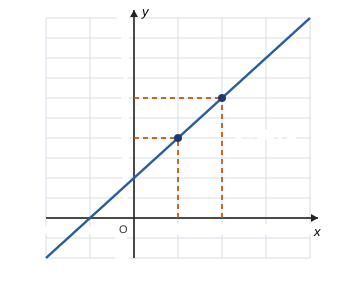
- Given x, find y: go up (or down) from x until you meet the graph, then go across to the y-axis.
- Given y, find x: go across from y until you meet the graph, then go down (or up) to the x-axis.
Example 7: reading a profit graph (textbook p. 159)
The profit graph of a stall is a straight line through the origin: 10 packets give RM5, 20 packets give RM10 and 40 packets give RM20. Then 26 packets give RM13, and 60 packets are predicted to give RM30, because the line goes on in the same direction. Reading values beyond the plotted part by following the trend is called a prediction. The inference: the more packets sold, the higher the profit.
Solving problems with graphs
Follow four steps: understand the problem, plan the strategy, carry it out by reading the graph, then write a conclusion with units (textbook pp. 160-161).
Example 8: Jibam's jump (textbook p. 161)
The height of Jibam is y = 6 + x − x² metres after x seconds, and a pebble moves with y = 2x.
- Maximum height: the highest point of the curve is (0.5, 6.25), so the maximum height is 6.25 m. (Check: 6 + 0.5 − 0.25 = 6.25.)
- The pebble touches Jibam where the two graphs meet. At x = 2: 6 + 2 − 4 = 4 and 2(2) = 4, so the meeting point is (2, 4): at the 2nd second.
- Jibam touches the ground when y = 0. At x = 3: 6 + 3 − 9 = 0, so at the 3rd second.
Show answerHide answer
b) −2 = 2x + 2, 2x = −4, x = −2
c) x² = 9, so x = 3 or x = −3