Mathematics questions, chapter 8
Nama / NameKelas / ClassTarikh / Date
Graphs of Functions
42 marks. Use Practice to check each answer as you go, or Exam to answer everything first. Graph paper and a ruler are needed for question B5. Show your working for Section B.
Section A: objective questions
12 marksChoose the correct answer. Each question carries 1 mark.
1
Question 1
Which statement describes a function?
Show answerHide answer
B
A function is a relation in which each object in the domain has only one image. Two objects may share an image (many-to-one), so "each image has one object" is not required. Objects with more than one image make the relation not a function.
2
Question 2
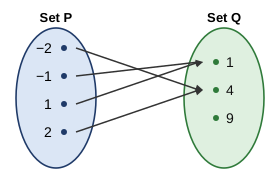
Diagram 1 shows the relation "the square of" from set P to set Q. What type of relation is shown?
Show answerHide answer
D
Each object has only one image, but two objects share the same image (−2 and 2 both go to 4; −1 and 1 both go to 1). That is a many-to-one relation, which is a function.
3
Question 3
Which set of ordered pairs is not a function?
Show answerHide answer
C
In {(2, 1), (2, 3), (4, 5)} the object 2 has two images, 1 and 3, so it is a one-to-many relation. In the other sets every first number appears only once, so each is a function (the first and last are many-to-one).
4
Question 4
The function f(x) = 2x + 3 has the domain {1, 2, 4}. What is the range?
Show answerHide answer
A
f(1) = 5, f(2) = 7 and f(4) = 2(4) + 3 = 11, so the range is {5, 7, 11}. {2, 4, 8} is the domain doubled (forgetting + 3), and {5, 7, 9} comes from using 3 for the last object instead of 4.
5
Question 5
Find the value of y when x = −2 for the function y = 2x² − 5.
Show answerHide answer
C
y = 2(−2)² − 5 = 2(4) − 5 = 3. −13 comes from treating (−2)² as −4. 11 comes from squaring 2 × (−2). −9 comes from not squaring: 2(−2) − 5.
6
Question 6
The graph of which function is a hyperbola (two separate branches)?
Show answerHide answer
D
y = 6x is a reciprocal function, and its graph is a hyperbola with two branches. y = 2x + 1 gives a straight line, y = x² − 4 a parabola and y = x³ + 2 a cubic curve.
7
Question 7
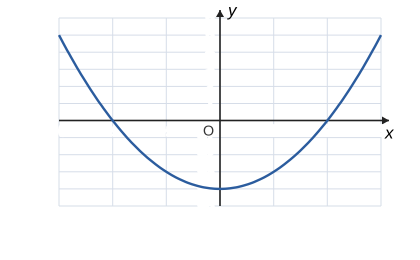
Diagram 2 shows the graph of a function. Which function does it represent?
Show answerHide answer
A
The graph is a U-shaped parabola, so the function is quadratic. At x = 0, y = −4, and at x = 2, y = 4 − 4 = 0, which match y = x² − 4. 4 − x² would open downwards, and x² + 4 has its lowest point at (0, 4).
8
Question 8
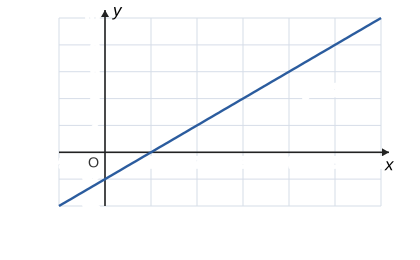
Diagram 3 shows the graph of y = 2x − 2. Find the value of x when y = 6.
Show answerHide answer
B
Draw a line across from y = 6 to the graph, then down to the x-axis: x = 4. Check: 2(4) − 2 = 6. 10 is the value of y when x = 6, and 2 is the value of y when x = 2.
9
Question 9
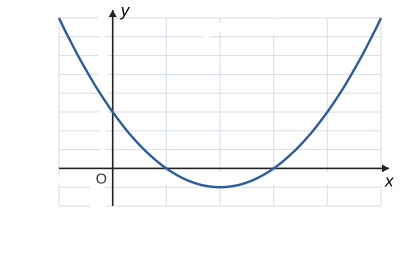
Diagram 4 shows the graph of y = x² − 4x + 3. What are the values of x when y = 0?
Show answerHide answer
D
y = 0 on the x-axis. The curve crosses the x-axis at x = 1 and x = 3. Check: 1 − 4 + 3 = 0 and 9 − 12 + 3 = 0. x = 2 is where the lowest point is, where y = −1.
10
Question 10
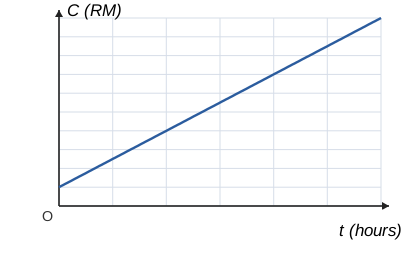
Diagram 5 shows the charge, C (in RM), for parking a car for t hours. Mr Lim parks his car for 4 hours. How much does he pay?
Show answerHide answer
A
At t = 4 the line is at C = 14, so he pays RM14. The line does not start at 0: there is a RM2 charge to enter, so 3 × 4 = 12 is not enough. RM11 is the charge for 3 hours.
11
Question 11
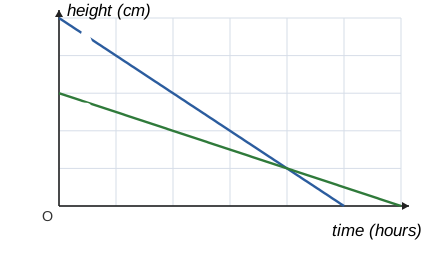
Diagram 6 shows the heights of two candles, A and B, that were lit at the same time. For which times is candle B taller than candle A?
Show answerHide answer
B
The lines cross at (8, 4): both candles are 4 cm tall after 8 hours. Before that candle A is taller. Between 8 and 12 hours the line for B is above the line for A, so B is taller (at 10 hours A is 0 cm and B is 2 cm). After 12 hours both have burnt out.
12
Question 12
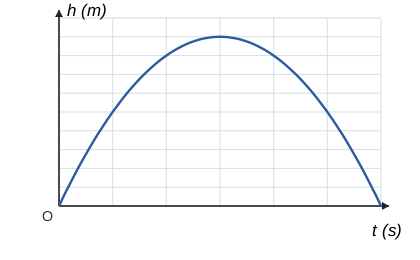
Diagram 7 shows the height, h metres, of a ball t seconds after it is kicked. For how many seconds is the ball higher than 5 m?
Show answerHide answer
B
The curve is at h = 5 when t = 1 and when t = 5 (check: 6 − 1 = 5 and 30 − 25 = 5). The ball is above 5 m from 1 s to 5 s, which is 5 − 1 = 4 seconds. 5 is only the second time the ball is at 5 m; 6 is the whole flight.
Section B: structured questions
30 marksAnswer all questions. Show your working.
13
Question 13
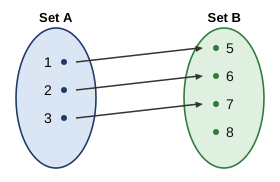
Diagram 8 shows the function f that maps x to x + 4 from set A to set B.
[1 mark]
(a)State the image of 3.
Show answerHide answer
Tick each point you got.
[2 marks]
(b)State the codomain and the range of the function.
Show answerHide answer
Tick each point you got.
14
Question 14
The function f is defined by f(x) = 2x − 1 for the domain P = {2, 3, 4, 5}.
[2 marks]
(a)Write the function as a set of ordered pairs.
Show answerHide answer
Tick each point you got.
[1 mark]
(b)State the range of the function.
Show answerHide answer
Tick each point you got.
15
Question 15
Diagram 9 shows two relations drawn as graphs of points.
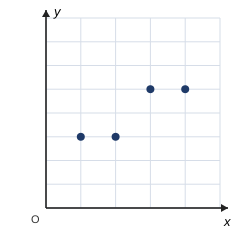
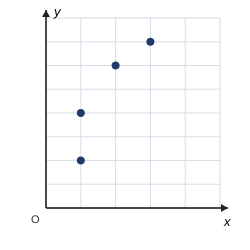
[2 marks]
(a)Is graph (a) a function? Give a reason.
Show answerHide answer
Tick each point you got.
[2 marks]
(b)Is graph (b) a function? Give a reason.
Show answerHide answer
Tick each point you got.
16
Question 16
The table shows some values of the function y = x² + x − 2.
| x | −3 | −2 | −1 | 0 | 1 | 2 |
|---|---|---|---|---|---|---|
| y | 4 | P | Q | −2 | R | 4 |
[2 marks]
(a)Find the values of P, Q and R.
Show answerHide answer
Tick each point you got.
[1 mark]
(b)What is the shape of the graph of this function?
Show answerHide answer
Tick each point you got.
[1 mark]
(c)Find the value of y when x = 3.
Show answerHide answer
Tick each point you got.
17
Question 17
Draw the graph of the function y = 2x − 3 for −1 ≤ x ≤ 3 on graph paper. Use a scale of 2 cm to 1 unit on both axes.
[2 marks]
(a)Construct a table of values for x = −1, 0, 1, 2 and 3.
Show answerHide answer
Tick each point you got.
[2 marks]
(b)Draw the axes with the scale, plot the points and draw the graph.
Show answerHide answer
Tick each point you got.
18
Question 18
Diagram 10 shows the graph of the function y = 12x.
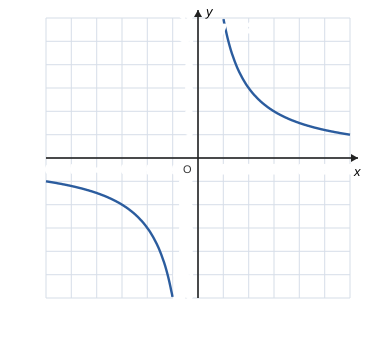
[1 mark]
(a)From the graph, find the value of y when x = 3.
Show answerHide answer
Tick each point you got.
[1 mark]
(b)Find the value of x when y = 2.
Show answerHide answer
Tick each point you got.
[1 mark]
(c)Find the value of x when y = −3.
Show answerHide answer
Tick each point you got.
19
Question 19
Diagram 11 shows the monthly cost of two prepaid phone plans, P and Q, for talk time of up to 40 minutes.
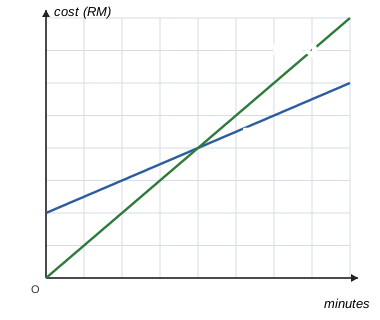
[1 mark]
(a)How much does each plan charge for 30 minutes of talk time?
Show answerHide answer
Tick each point you got.
[1 mark]
(b)For how many minutes of talk time is the cost the same for both plans?
Show answerHide answer
Tick each point you got.
[1 mark]
(c)Tina uses 40 minutes a month. Which plan should she choose, and how much will she save?
Show answerHide answer
Tick each point you got.
[1 mark]
(d)Rizal uses only 10 minutes a month. Which plan is cheaper for him? Explain.
Show answerHide answer
Tick each point you got.
20
Question 20
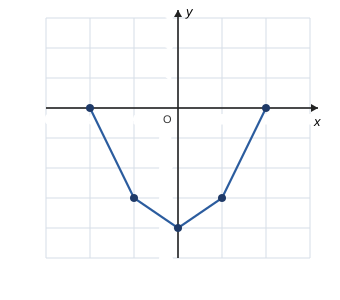
Hana drew the graph of the function y = x² − 4 for −2 ≤ x ≤ 2. Diagram 12 shows her graph.
[1 mark]
(a)Hana's graph has a mistake in the way the points are joined. What is it?
Show answerHide answer
Tick each point you got.
[1 mark]
(b)Find the value of y when x = 3.
Show answerHide answer
Tick each point you got.
[1 mark]
(c)State the lowest value of y on the graph and the value of x where it happens.
Show answerHide answer
Tick each point you got.
21
Question 21
A gym charges a joining fee of RM20 and RM10 for every visit. Let RMy be the total cost after x visits.
[1 mark]
(a)Write a function that gives y in terms of x.
Show answerHide answer
Tick each point you got.
[1 mark]
(b)State the shape of the graph and give a reason.
Show answerHide answer
Tick each point you got.