Mathematics notes, chapter 7
Graphs of Motion
Textbook Mathematics Form 4 KSSM (DLP), pages 182–209
What this chapter covers
- Draw distance-time graphs from a table of values or from an equation (7.1.1)
- {'Interpret distance-time graphs': 'gradient as speed, stationary periods, return journeys, average speed (7.1.2)'}
- Solve problems involving distance-time graphs (7.1.3)
- Draw speed-time graphs from a table of values or from an equation (7.2.1)
- Relate the area under a speed-time graph to the distance travelled and calculate it (7.2.2)
- {'Interpret speed-time graphs': 'acceleration, uniform speed and deceleration (7.2.3)'}
- Solve problems involving speed-time graphs (7.2.4)
7.1Distance-time graphs
In a distance-time graph the vertical axis is distance and the horizontal axis is time. The gradient of the graph is the rate of change of distance with respect to time, which is the speed.
Drawing a distance-time graph
You can draw the graph from a table or from an equation linking distance and time.
- Choose suitable scales for distance and time.
- Plot a point for each pair of values.
- Join the points with a ruler.
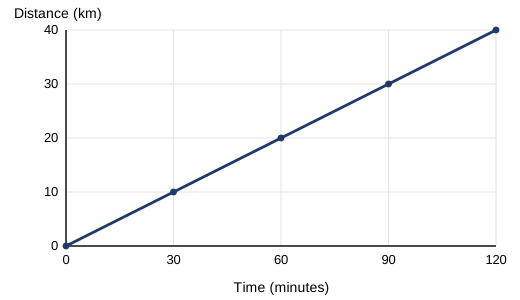
Example 1 (textbook p. 184): a cyclist in training
| Time (minutes) | 0 | 30 | 60 | 90 | 120 |
|---|---|---|---|---|---|
| Distance (km) | 0 | 10 | 20 | 30 | 40 |
Example 2 (textbook p. 185): from an equation
A car travels so that s = 80t, where s is the distance in km and t the time in hours, for 0 ≤ t ≤ 3.t = 0 gives s = 0, and t = 3 gives s = 240. Plot (0, 0) and (3, 240) and join them.
Two points are enough to draw a straight line. Use a third point to check your line. For s = 8 − t/5 (0 ≤ t ≤ 40) the end points are (0, 8) and (40, 0). The line goes down, which means the distance from the finish is decreasing.
Interpreting a distance-time graph
| Part of the graph | Gradient | What the object does |
|---|---|---|
| Slopes upwards | Positive | Moving away at a uniform speed |
| Horizontal | Zero | Stationary (distance does not change) |
| Slopes downwards | Negative | Moving back towards the start, or in the opposite direction |
Example 5 (textbook p. 188): a car for 4.5 hours
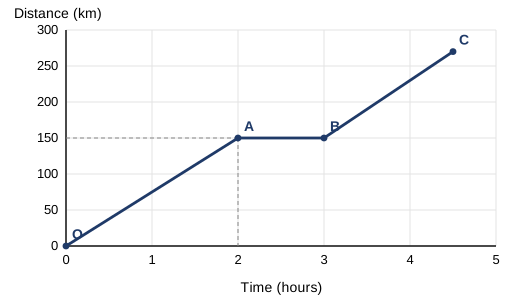
- OA: speed = 150 ÷ 2 = 75 km/h.
- AB: horizontal, so the car is stationary for 1 hour (3 − 2).
- BC: speed = (270 − 150) ÷ (4.5 − 3) = 120 ÷ 1.5 = 80 km/h.
Average speed = total distance ÷ total time. Include the time spent stationary. For the journey above, 270 ÷ 4.5 = 60 km/h.
Do not read a downward slope as "slowing down". On a distance-time graph it means the object is coming back. The speed is the size of the gradient, so ignore the minus sign when asked for speed.
Check the units. If time is in minutes and the answer must be in km/h, change minutes to hours first (20 minutes = 1/3 hour).
Example 9 (textbook p. 192): equal gradients
Graph OA (0 to 52 minutes, 0 to 65 km) and graph BC (77 minutes to t minutes, 65 km to 135 km) have the same gradient.65 ÷ 52 = 70 ÷ (t − 77), so t − 77 = 70 × 52 ÷ 65 = 56 and t = 133 minutes.
Distance = speed × time, time = distance ÷ speed. Two journeys with the same speed are drawn with parallel lines, so equal gradients let you form an equation to find an unknown value.
A distance-time graph rises from (0, 0) to (30 minutes, 12 km), is flat until 45 minutes, then rises to (60 minutes, 18 km). Find the average speed for the whole hour.
Show answerHide answer
Total distance = 18 km, total time = 60 minutes = 1 hour. Average speed = 18 km/h.
7.2Speed-time graphs
In a speed-time graph the vertical axis is speed and the horizontal axis is time. The gradient is the rate of change of speed, the acceleration. The area under the graph is the distance travelled.
Drawing a speed-time graph
The method is the same: table or equation, plot points, join with a ruler.
Example 11 (textbook p. 196): from an equation
A plane lands with v = 800 − 1 600t (v in km/h, t in hours), 0 ≤ t ≤ 0.5.t = 0 gives v = 800. t = 0.5 gives v = 800 − 800 = 0. Plot (0, 800) and (0.5, 0).
Interpreting a speed-time graph
| Part of the graph | Gradient | What the object does |
|---|---|---|
| Slopes upwards | Positive | Acceleration: the speed increases |
| Horizontal | Zero | Uniform speed: no change of speed |
| Slopes downwards | Negative | Deceleration: the speed decreases, the direction stays the same |
Area under the graph = distance travelled
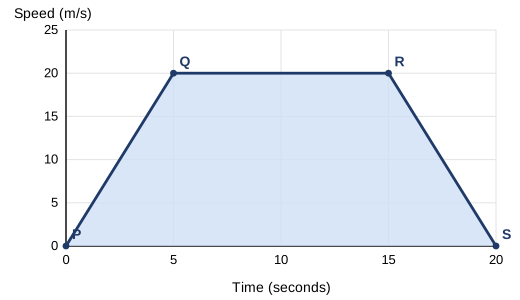
| Part | Motion | Gradient | Area (distance) |
|---|---|---|---|
| PQ | Acceleration | 20 ÷ 5 = 4 m/s² | ½ × 5 × 20 = 50 m |
| QR | Uniform speed | 0 | 10 × 20 = 200 m |
| RS | Deceleration | −20 ÷ 5 = −4 m/s² | ½ × 5 × 20 = 50 m |
Total distance = 50 + 200 + 50 = 300 m. Average speed = 300 ÷ 20 = 15 m/s.
Acceleration = change of speed ÷ change of time, in m/s². A negative value is deceleration: the object slows down but keeps moving in the same direction.
Trapezium area
Speed 40 m/s for 6 s, then rising steadily to 70 m/s at 10 s.
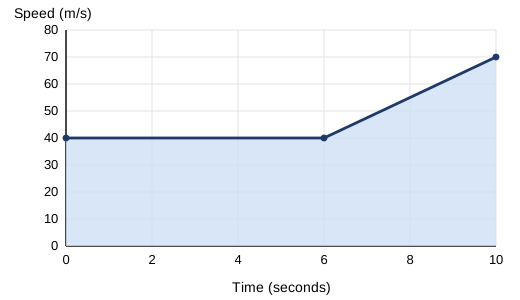
Area of trapezium = ½ × (sum of parallel sides) × width. The parallel sides are the two speeds, the width is the time.
Do not confuse the two graphs. A horizontal line is stationary on a distance-time graph but uniform speed on a speed-time graph. Only the area under a speed-time graph gives distance.
If time is in minutes and speed in km/h, change the time to hours before finding the area (textbook p. 198: 6 minutes = 6/60 h).
Solving problems
Use these tools: gradient for acceleration, area for distance, total distance ÷ total time for average speed. For an unknown value such as t or v, write the area or the gradient as an equation and solve it.
Example 16(a) (textbook p. 203): average speed
Speed rises from 5 to 10 m/s in 4 s, stays at 10 m/s until the 6th second.Distance in the first 6 s = ½ × 4 × (5 + 10) + 2 × 10 = 30 + 20 = 50 m.
Average speed = 50 ÷ 6 = 25/3 m/s.
A cyclist accelerates from 0 to 8 m/s in 4 s and then rides at 8 m/s for 6 s. Find the acceleration and the total distance.
Show answerHide answer
Acceleration = 8 ÷ 4 = 2 m/s². Distance = ½ × 4 × 8 + 6 × 8 = 16 + 48 = 64 m.