Mathematics questions, chapter 7
Nama / NameKelas / ClassTarikh / Date
Graphs of Motion
45 marks. Use Practice to check each answer as you go, or Exam to answer everything first. Show your working for Section B.
Section A: objective questions
12 marksChoose the correct answer. Each question carries 1 mark.
1
Question 1
The gradient of a distance-time graph represents the
Show answerHide answer
B
Gradient = change in distance ÷ change in time, which is speed. Acceleration is the gradient of a speed-time graph.
2
Question 2
The area under a speed-time graph represents the
Show answerHide answer
D
Area = speed × time = distance travelled.
3
Question 3
A horizontal straight line on a distance-time graph shows that the object is
Show answerHide answer
C
A zero gradient means no change in distance, so the object is stationary. On a speed-time graph a horizontal line means uniform speed instead.
4
Question 4
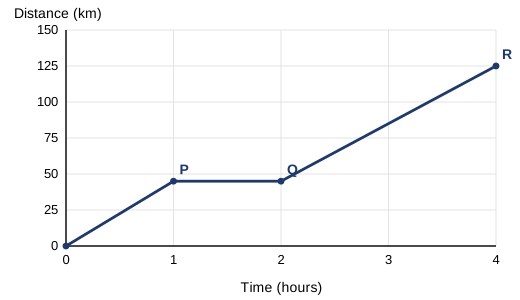
Diagram 1 shows a distance-time graph of a car. Calculate the speed of the car from Q to R.
Show answerHide answer
C
Speed = (125 − 45) ÷ (4 − 2) = 80 ÷ 2 = 40 km/h. 31.25 is 125 ÷ 4 (the average speed) and 80 forgets to divide by the time.
5
Question 5
On a distance-time graph, a part of the line with a negative gradient shows that the object
Show answerHide answer
B
The distance from the starting point is decreasing, so the object is returning (or moving in the opposite direction). Deceleration is a speed-time graph idea.
6
Question 6
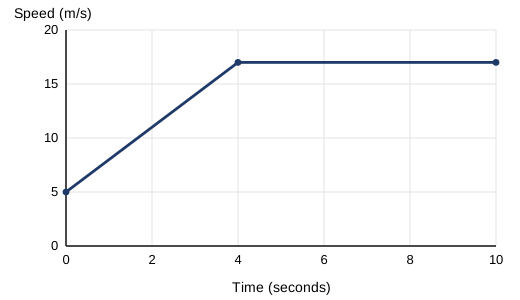
Diagram 2 shows a speed-time graph. Calculate the acceleration in the first 4 seconds.
Show answerHide answer
A
Acceleration = (17 − 5) ÷ (4 − 0) = 12 ÷ 4 = 3 m/s². 4.25 is 17 ÷ 4 (it ignores the starting speed).
7
Question 7
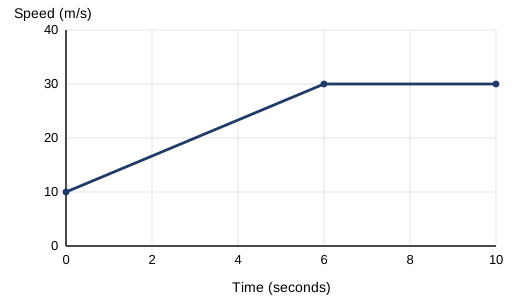
Diagram 3 shows the speed-time graph of a van for 10 seconds. Calculate the total distance travelled.
Show answerHide answer
C
Trapezium: ½ × 6 × (10 + 30) = 120 m. Rectangle: 4 × 30 = 120 m. Total = 240 m. 300 m is 10 × 30 (it treats the whole journey as uniform speed).
8
Question 8
A car travels at a uniform speed of 72 km/h for 20 minutes. What distance does it travel?
Show answerHide answer
A
20 minutes = 1/3 hour. Distance = 72 × 1/3 = 24 km. 1 440 km uses 20 hours.
9
Question 9
A cyclist rides 12 km in 40 minutes, rests for 20 minutes, then ends the ride. What is the average speed for the whole 1 hour?
Show answerHide answer
D
Average speed = total distance ÷ total time = 12 km ÷ 1 h = 12 km/h. The rest time must be included. 18 km/h is the speed while riding.
10
Question 10
Two cars are drawn on the same distance-time graph. Car P has a steeper line than car Q. Which statement is true?
Show answerHide answer
A
A steeper line has a bigger gradient, so a greater speed. Equal speeds would give parallel lines.
11
Question 11
A cyclist's distance from the finishing line is s = 20 − 0.5t, where s is in km and t is in minutes. Find t when s = 8.
Show answerHide answer
C
8 = 20 − 0.5t, so 0.5t = 12 and t = 24. 16 would come from 0.5t = 8 (using s instead of 20 − s); t = 40 is when s = 0.
12
Question 12
A train slows down from 24 m/s to rest in 8 s. Its deceleration is
Show answerHide answer
D
Change of speed = (0 − 24) ÷ 8 = −3 m/s², so the deceleration is 3 m/s². 0.33 is 8 ÷ 24 (the fraction inverted) and 192 is 24 × 8.
Section B: structured questions
33 marksAnswer all questions. Show your working.
13
Question 13
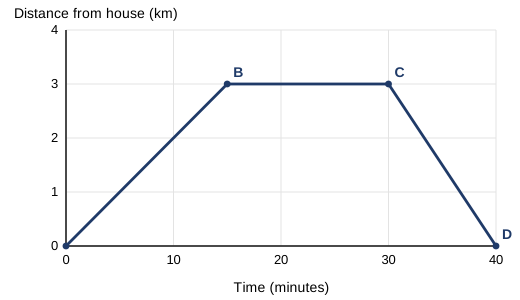
Diagram 4 shows Sahana's walk from her house to a library and back. A is her house.
[1 mark]
(a)For how many minutes was she at the library?
Show answerHide answer
Tick each point you got.
[2 marks]
(b)Calculate her speed, in km/h, from A to B.
Show answerHide answer
Tick each point you got.
[2 marks]
(c)Calculate her speed, in km/h, from C to D.
Show answerHide answer
Tick each point you got.
[2 marks]
(d)Calculate her average speed, in km/h, for the whole journey.
Show answerHide answer
Tick each point you got.
14
Question 14
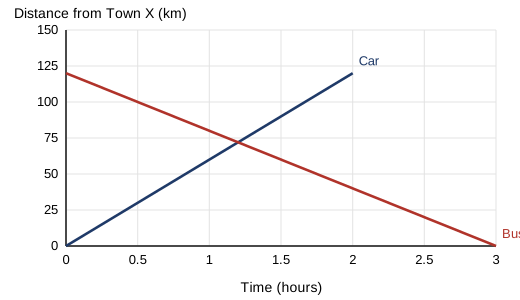
Diagram 5 shows a car travelling from Town X to Town Y, and a bus from Town Y to Town X. The towns are 120 km apart.
[1 mark]
(a)Calculate the speed of the car.
Show answerHide answer
Tick each point you got.
[1 mark]
(b)Calculate the speed of the bus.
Show answerHide answer
Tick each point you got.
[2 marks]
(c)The two vehicles meet when 60t = 120 − 40t. Find the time they meet and their distance from Town X.
Show answerHide answer
Tick each point you got.
15
Question 15
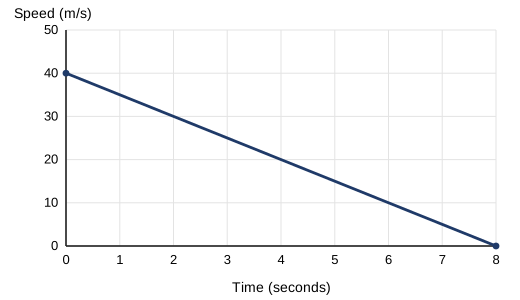
A car brakes so that v = 40 − 5t, where v is the speed in m/s and t the time in seconds, for 0 ≤ t ≤ 8. Diagram 6 shows the speed-time graph.
[2 marks]
(a)State the speed when t = 0 and when t = 8.
Show answerHide answer
Tick each point you got.
[1 mark]
(b)State the deceleration.
Show answerHide answer
Tick each point you got.
[2 marks]
(c)Calculate the distance travelled before the car stops.
Show answerHide answer
Tick each point you got.
16
Question 16
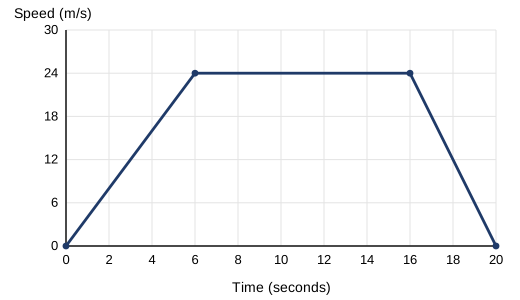
Diagram 7 shows the speed-time graph of a motorcycle for 20 seconds.
[1 mark]
(a)Calculate the acceleration in the first 6 seconds.
Show answerHide answer
Tick each point you got.
[1 mark]
(b)Calculate the deceleration in the last 4 seconds.
Show answerHide answer
Tick each point you got.
[1 mark]
(c)Calculate the distance travelled at uniform speed.
Show answerHide answer
Tick each point you got.
[2 marks]
(d)Calculate the total distance for the 20 seconds.
Show answerHide answer
Tick each point you got.
[1 mark]
(e)Calculate the average speed.
Show answerHide answer
Tick each point you got.
17
Question 17
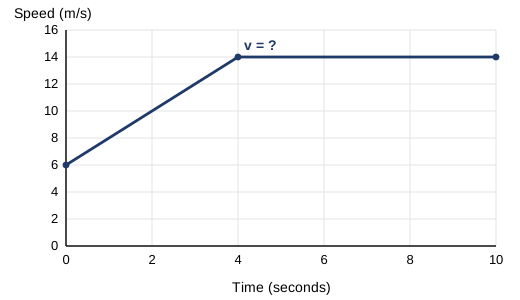
Diagram 8 shows the speed of a car for 10 seconds. The speed rises from 6 m/s to v m/s in 4 seconds, then stays at v m/s. The total distance travelled is 124 m.
[3 marks]
(a)Find the value of v.
Show answerHide answer
Tick each point you got.
[1 mark]
(b)Calculate the acceleration in the first 4 seconds.
Show answerHide answer
Tick each point you got.
18
Question 18
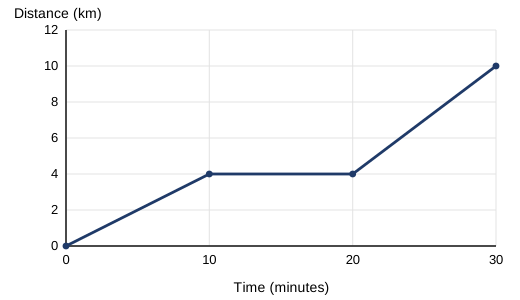
Diagram 9 shows a distance-time graph. Aiman says, "The horizontal part shows the car moving at a constant speed."
[1 mark]
(a)Is Aiman correct? Explain.
Show answerHide answer
Tick each point you got.
[2 marks]
(b)Calculate the speed, in km/h, of the car in the last 10 minutes.
Show answerHide answer
Tick each point you got.
19
Question 19
Hana cycles 6 km from her house to a park in 30 minutes at a uniform speed. She rests for 15 minutes, then cycles home in 45 minutes.
[1 mark]
(a)Write the coordinates (time in minutes, distance in km) of the four points you would plot to draw her distance-time graph.
Show answerHide answer
Tick each point you got.
[1 mark]
(b)Calculate her speed, in km/h, on the way to the park.
Show answerHide answer
Tick each point you got.
[1 mark]
(c)Calculate her speed, in km/h, on the way home.
Show answerHide answer
Tick each point you got.
[1 mark]
(d)Calculate her average speed, in km/h, for the whole journey.
Show answerHide answer
Tick each point you got.