Mathematics questions, chapter 8
Nama / NameKelas / ClassTarikh / Date
Measures of Dispersion for Ungrouped Data
45 marks. Use Practice to check each answer as you go, or Exam to answer everything first. Show your working for Section B. Standard deviation here means the population standard deviation (divide by N), as in the textbook.
Section A: objective questions
12 marksChoose the correct answer. Each question carries 1 mark.
1
Question 1
A set of data has a very small range. What does this tell you about its dispersion?
Show answerHide answer
B
A small range means the largest and smallest values are close, so the dispersion is small. The size of the mean says nothing about dispersion.
2
Question 2
Find the range of 17, 9, 31, 22, 8, 25.
Show answerHide answer
D
Range = largest − smallest = 31 − 8 = 23. 22 comes from 31 − 9, which is not the smallest value.
3
Question 3
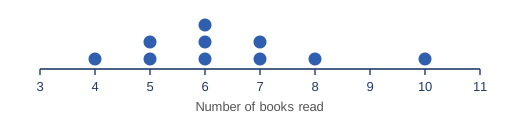
Diagram 1 shows a dot plot of the number of books read by 10 pupils in a month. What is the difference between the largest and the smallest value?
Show answerHide answer
A
The smallest value is 4 and the largest is 10. 10 − 4 = 6. The answer 7 comes from 10 − 3, using the start of the scale instead of the smallest dot.
4
Question 4
Find the interquartile range of 3, 5, 6, 8, 9, 12, 14.
Show answerHide answer
C
n = 7, the median is 8. The lower part is 3, 5, 6 so Q1 = 5. The upper part is 9, 12, 14 so Q3 = 12. IQR = 12 − 5 = 7. 11 is the range.
5
Question 5
The table shows the scores of 40 pupils in a quiz. Find the interquartile range.
| Score | 1 | 2 | 3 | 4 | 5 |
|---|---|---|---|---|---|
| Number of pupils | 3 | 5 | 12 | 14 | 6 |
Show answerHide answer
A
Cumulative frequencies: 3, 8, 20, 34, 40. Q1 is the 10th value = 3. Q3 is the 30th value = 4. IQR = 4 − 3 = 1. The range is 4.
6
Question 6
Find the variance of 2, 4, 6, 8.
Show answerHide answer
D
Mean = 5. Variance = (9 + 1 + 1 + 9) ÷ 4 = 5. 2.24 is the standard deviation. 6.67 comes from dividing by 3 instead of 4.
7
Question 7
The values 12, 14, 15, 15, 17, 18, 90 contain an outlier. Which measure of dispersion is the most suitable to describe the data?
Show answerHide answer
B
The interquartile range ignores the extreme values, so it is not affected much by the outlier 90. The range depends on 90. Mean and median are not measures of dispersion.
8
Question 8
A set of data has a standard deviation of 2.5. Each value is multiplied by 4 and then 3 is subtracted. What is the new variance?
Show answerHide answer
C
Subtracting 3 changes nothing. Multiplying by 4 makes the standard deviation 10, so the variance is 10² = 100. 10 is the new standard deviation.
9
Question 9
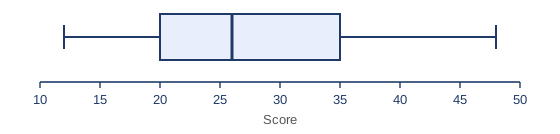
Diagram 2 shows a box plot of the times taken, in seconds, by a group of pupils. What is the interquartile range?
Show answerHide answer
A
The box runs from Q1 = 20 to Q3 = 35. IQR = 35 − 20 = 15. 36 is the range, 48 − 12.
10
Question 10
Five numbers have a sum of 60 and a sum of squares of 800. What is the standard deviation?
Show answerHide answer
D
Mean = 12. Variance = 800 ÷ 5 − 12² = 160 − 144 = 16. Standard deviation = √16 = 4. 16 is the variance.
11
Question 11
Amir and Bala each took 5 tests. Both have a mean mark of 68. The standard deviation of Amir's marks is 3.1 and Bala's is 8.4. Which statement is correct?
Show answerHide answer
B
With equal means, the smaller standard deviation shows marks closer to the mean, which is more consistent. The standard deviation does not say who scored higher.
12
Question 12
A set of data has a range of 15, an interquartile range of 10.5 and a standard deviation of 5.3. Each value is decreased by 7. What are the new range, interquartile range and standard deviation?
Show answerHide answer
C
Adding or subtracting the same number shifts the data but does not change how spread out it is. All three measures stay the same.
Section B: structured questions
33 marksAnswer all questions. Show your working.
13
Question 13
The ages, in years, of 12 members of a swimming club are 15, 22, 18, 30, 25, 18, 20, 27, 24, 16, 21, 19.
[2 marks]
(a)Arrange the ages in ascending order and state the range.
Show answerHide answer
Tick each point you got.
[2 marks]
(b)Find the first quartile and the third quartile.
Show answerHide answer
Tick each point you got.
[1 mark]
(c)Find the interquartile range.
Show answerHide answer
Tick each point you got.
14
Question 14
A set of data is 6, 8, 9, 11, 16.
[1 mark]
(a)Calculate the mean.
Show answerHide answer
Tick each point you got.
[2 marks]
(b)Calculate the variance.
Show answerHide answer
Using squared differences: (16 + 4 + 1 + 1 + 36) ÷ 5 = 58 ÷ 5 = 11.6.
Tick each point you got.
[1 mark]
(c)Calculate the standard deviation, correct to 3 decimal places.
Show answerHide answer
Tick each point you got.
15
Question 15
The table shows the number of goals scored by a school team in 20 matches.
| Number of goals | 0 | 1 | 2 | 3 | 4 |
|---|---|---|---|---|---|
| Number of matches | 4 | 7 | 5 | 3 | 1 |
[1 mark]
(a)Calculate the mean number of goals.
Show answerHide answer
Tick each point you got.
[3 marks]
(b)Calculate the variance and the standard deviation.
Show answerHide answer
Tick each point you got.
16
Question 16
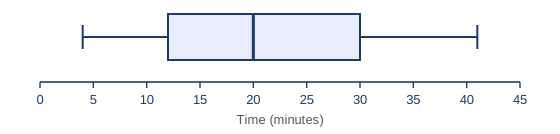
Diagram 3 shows a box plot of the time, in minutes, that 15 pupils spent on homework in one evening.
[2 marks]
(a)State the median and the third quartile.
Show answerHide answer
Tick each point you got.
[2 marks]
(b)Find the range and the interquartile range.
Show answerHide answer
Tick each point you got.
17
Question 17
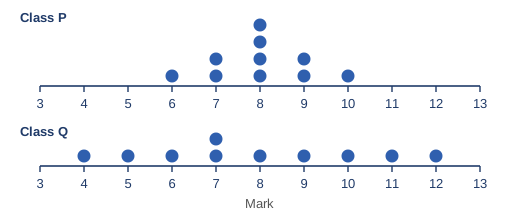
Diagram 4 shows dot plots of the marks of 10 pupils from Class P and 10 pupils from Class Q in the same test.
[2 marks]
(a)Which class has the greater dispersion? Give a reason.
Show answerHide answer
Tick each point you got.
[1 mark]
(b)Both classes have a mean mark close to 8. Which class is more consistent in this test? Explain.
Show answerHide answer
Tick each point you got.
18
Question 18
A coach must choose one of two athletes for a 100 m race. The times, in seconds, of five trials are shown.
| Athlete A | 12.6 | 12.4 | 12.9 | 12.5 | 12.6 |
|---|---|---|---|---|---|
| Athlete B | 12.2 | 13.1 | 12.5 | 12.9 | 12.8 |
[2 marks]
(a)Calculate the mean time of each athlete.
Show answerHide answer
Tick each point you got.
[3 marks]
(b)Calculate the standard deviation of each athlete's times, correct to 3 decimal places.
Show answerHide answer
For B: Σx² = 806.95, so variance = 806.95 ÷ 5 − 12.7² = 161.39 − 161.29 = 0.1.
Tick each point you got.
[1 mark]
(c)Which athlete is more consistent? Give a reason.
Show answerHide answer
Tick each point you got.
19
Question 19
A set of 10 numbers has Σx = 80 and Σx² = 700.
[2 marks]
(a)Calculate the mean and the variance.
Show answerHide answer
Tick each point you got.
[2 marks]
(b)A number p is added to the set and the mean becomes 9. Find the value of p.
Show answerHide answer
Tick each point you got.
[2 marks]
(c)Find the standard deviation of the new set of 11 numbers.
Show answerHide answer
Tick each point you got.
[1 mark]
(d)State whether the standard deviation became larger or smaller. Explain.
Show answerHide answer
larger
p = 19 is far from the old mean 8, so the standard deviation increases from 2.449 to 3.931.