Mathematics questions, chapter 7
Nama / NameKelas / ClassTarikh / Date
Measures of Dispersion for Grouped Data
42 marks. Use Practice to check each answer as you go, or Exam to answer everything first. Show your working for Section B. A scientific calculator is allowed.
Section A: objective questions
13 marksChoose the correct answer. Each question carries 1 mark.
1
Question 1
A frequency table has the classes 20 – 24 and 25 – 29. What is the lower boundary of the class 25 – 29?
Show answerHide answer
B
Lower boundary = (24 + 25) ÷ 2 = 24.5. It is halfway between the upper limit of the class before and the lower limit of this class.
2
Question 2
The classes of a frequency table for heights in metres are 1.0 – 1.9, 2.0 – 2.9, 3.0 – 3.9, … What is the size of each class interval?
Show answerHide answer
C
Size = difference between two consecutive lower limits = 2.0 − 1.0 = 1.0. Using 1.9 − 1.0 = 0.9 (limits of one class) is the common mistake.
3
Question 3
The frequencies of four consecutive classes are 4, 9, 13 and 8. What is the cumulative frequency of the third class?
Show answerHide answer
B
4 + 9 + 13 = 26. 34 is the cumulative frequency of the fourth class; 22 leaves out the first class.
4
Question 4
In an ogive, the cumulative frequency is plotted against the ______ of each class.
Show answerHide answer
D
An ogive uses the upper boundary because the cumulative frequency counts all the values up to that boundary.
5
Question 5
When drawing a frequency polygon, a class with zero frequency is added before the first class and after the last class. Why?
Show answerHide answer
A
The two extra midpoints with frequency 0 let the polygon close at the axis. They do not change the total frequency or the data.
6
Question 6
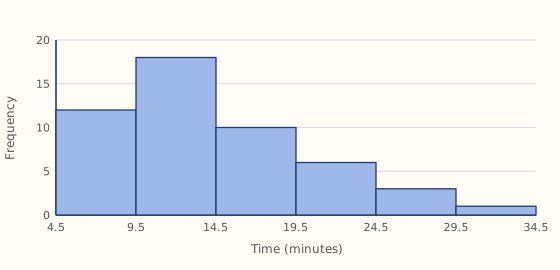
Diagram 1 shows the time taken by pupils to travel to school. What is the shape of the distribution?
Show answerHide answer
C
Most pupils have short travel times and the long tail is on the right (the larger values), so it is skewed to the right. Skewness is named after the tail, not the peak.
7
Question 7
An ogive is drawn for 120 data. At which cumulative frequency is the third quartile Q3 read?
Show answerHide answer
C
Position of Q3 = ¾ × 120 = 90. 30 is for Q1 and 60 is for the median.
8
Question 8
An ogive is drawn for 200 data. At which cumulative frequency is the 35th percentile, P35, read?
Show answerHide answer
B
35% of 200 = 0.35 × 200 = 70. 35 is the percentile itself, not the position.
9
Question 9
A frequency table has the classes 10 – 19, 20 – 29, 30 – 39, 40 – 49 and 50 – 59. What is the range of the data?
Show answerHide answer
A
Range = midpoint of the highest class − midpoint of the lowest class = 54.5 − 14.5 = 40. 49 comes from 59 − 10, which uses the limits.
10
Question 10
For 50 data, Σfx = 2 000 and Σfx² = 82 000. What is the standard deviation?
Show answerHide answer
B
Mean = 2 000 ÷ 50 = 40. Variance = 82 000 ÷ 50 − 40² = 1 640 − 1 600 = 40. Standard deviation = √40 = 6.32. 40 is the variance, not the standard deviation.
11
Question 11
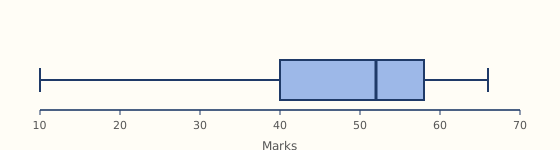
Diagram 2 shows a box plot of the marks of a group of pupils. Which statement describes the distribution?
Show answerHide answer
D
The left whisker (10 to 40) and the left part of the box (40 to 52) are longer than the right ones (58 to 66 and 52 to 58), so it is skewed to the left.
12
Question 12
Set A has mean 68 and standard deviation 4.2. Set B has mean 68 and standard deviation 7.5. Which conclusion is correct?
Show answerHide answer
A
With equal means, the set with the smaller standard deviation has its values closer to the mean, so it is more consistent.
13
Question 13
The classes 0 – 9, 10 – 19 and 20 – 29 have frequencies 4, 10 and 6. What is the mean?
Show answerHide answer
D
Midpoints 4.5, 14.5, 24.5. Σfx = 18 + 145 + 147 = 310. Mean = 310 ÷ 20 = 15.5.
Section B: structured questions
29 marksAnswer all questions. Show your working.
14
Question 14
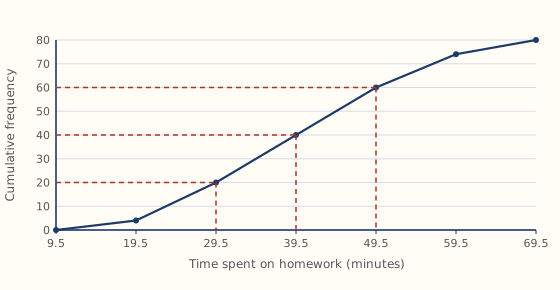
Diagram 3 is an ogive of the time spent on homework by 80 pupils in one night.
[3 marks]
(a)Find the first quartile, the median and the third quartile. (Accept values within 1 minute.)
Show answerHide answer
Tick each point you got.
[2 marks]
(b)Hence find the interquartile range and say what it means.
Show answerHide answer
Tick each point you got.
[2 marks]
(c)Find the 90th percentile, P90. (Accept 57 to 59.)
Show answerHide answer
Tick each point you got.
[1 mark]
(d)What percentage of the pupils spent 44.5 minutes or less?
Show answerHide answer
Tick each point you got.
15
Question 15
The table shows the time, in seconds, taken by 40 swimmers to complete a lap.
| Time (s) | 20 – 29 | 30 – 39 | 40 – 49 | 50 – 59 | 60 – 69 |
|---|---|---|---|---|---|
| Number of swimmers | 5 | 9 | 14 | 8 | 4 |
[2 marks]
(a)Calculate the mean time.
Show answerHide answer
Tick each point you got.
[2 marks]
(b)Calculate the variance, correct to 2 decimal places.
Show answerHide answer
Tick each point you got.
[1 mark]
(c)Hence find the standard deviation.
Show answerHide answer
Tick each point you got.
[1 mark]
(d)Find the range of the data.
Show answerHide answer
Tick each point you got.
16
Question 16
Two classes, A and B, took the same Mathematics test (30 pupils each).
| Marks | 11 – 20 | 21 – 30 | 31 – 40 | 41 – 50 | 51 – 60 |
|---|---|---|---|---|---|
| Class A | 2 | 6 | 12 | 7 | 3 |
| Class B | 1 | 4 | 8 | 10 | 7 |
[2 marks]
(a)Find the mean mark of each class.
Show answerHide answer
Tick each point you got.
[2 marks]
(b)Find the standard deviation of each class, correct to 2 decimal places.
Show answerHide answer
Tick each point you got.
[2 marks]
(c)Which class did better and which class was more consistent? Justify your answer.
Show answerHide answer
Tick each point you got.
17
Question 17
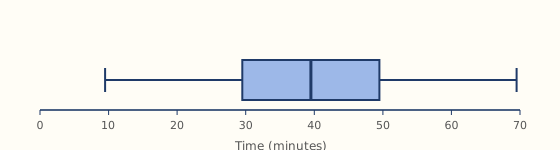
Diagram 4 is a box plot of the homework times of the same 80 pupils as in Diagram 3.
[2 marks]
(a)State the five values shown on the box plot.
Show answerHide answer
Tick each point you got.
[1 mark]
(b)State the interquartile range.
Show answerHide answer
Tick each point you got.
[2 marks]
(c)Describe the shape of the distribution and give a reason.
Show answerHide answer
Tick each point you got.
18
Question 18
Your class will investigate the daily time spent on screens by Form 5 pupils in your school, and report with measures of central tendency and dispersion.
[2 marks]
(a)Describe how you would choose 40 respondents and state one question you would ask.
Show answerHide answer
Tick each point you got.
[2 marks]
(b)Name two graphs and two measures you would use, and say why.
Show answerHide answer
Tick each point you got.